class: center, middle, inverse, title-slide # Data Visualisation in R ## Introduction to ggplot2 ### Dr. Laurie Baker ### Data Science Campus ### 2020/04/09 (updated: 2021-09-09) --- layout: false class: inverse center middle text-white .font200[Introduction to ggplot2] --- layout: true # What we'll cover today. --- - Brief intro to the theory behind `ggplot2` and the "grammar of graphics". -- - The layers used to build a plot using `ggplot2`. -- * The concepts of tidy data. -- * How to use different geoms to create different types of plots (e.g. geom_line, geom_point). -- * Understand how to customise a plot using labs, theme, facet. .footnote[Slides and code adapted from Garrick Aden-Buie "Gentle ggplot2 tutorial" on GitHub: <http://github.com/gadenbuie/gentle-ggplot2>] --- layout: true # How would you draw a line graph by hand? --- .left-column[ <table> <thead> <tr> <th style="text-align:left;"> country </th> <th style="text-align:right;"> year </th> <th style="text-align:right;"> pop </th> </tr> </thead> <tbody> <tr> <td style="text-align:left;"> Chile </td> <td style="text-align:right;"> 1997 </td> <td style="text-align:right;"> 14.60 </td> </tr> <tr> <td style="text-align:left;"> Chile </td> <td style="text-align:right;"> 2002 </td> <td style="text-align:right;"> 15.50 </td> </tr> <tr> <td style="text-align:left;"> Chile </td> <td style="text-align:right;"> 2007 </td> <td style="text-align:right;"> 16.30 </td> </tr> <tr> <td style="text-align:left;"> Rwanda </td> <td style="text-align:right;"> 1997 </td> <td style="text-align:right;"> 7.21 </td> </tr> <tr> <td style="text-align:left;"> Rwanda </td> <td style="text-align:right;"> 2002 </td> <td style="text-align:right;"> 7.85 </td> </tr> <tr> <td style="text-align:left;"> Rwanda </td> <td style="text-align:right;"> 2007 </td> <td style="text-align:right;"> 8.86 </td> </tr> <tr> <td style="text-align:left;"> Syria </td> <td style="text-align:right;"> 1997 </td> <td style="text-align:right;"> 15.10 </td> </tr> <tr> <td style="text-align:left;"> Syria </td> <td style="text-align:right;"> 2002 </td> <td style="text-align:right;"> 17.20 </td> </tr> <tr> <td style="text-align:left;"> Syria </td> <td style="text-align:right;"> 2007 </td> <td style="text-align:right;"> 19.30 </td> </tr> </tbody> </table> ] -- .right-column[.font150[ 1. Draw the axes, add tick marks. 2. Draw each line. Colour by country. 3. Add the axes labels. 4. Add a title. 5. Add a legend. ]] --- layout: true # How would you draw a bar graph by hand? --- .left-column[ <table> <thead> <tr> <th style="text-align:left;"> country </th> <th style="text-align:right;"> year </th> <th style="text-align:right;"> pop </th> </tr> </thead> <tbody> <tr> <td style="text-align:left;"> Chile </td> <td style="text-align:right;"> 1997 </td> <td style="text-align:right;"> 14.60 </td> </tr> <tr> <td style="text-align:left;"> Chile </td> <td style="text-align:right;"> 2002 </td> <td style="text-align:right;"> 15.50 </td> </tr> <tr> <td style="text-align:left;"> Chile </td> <td style="text-align:right;"> 2007 </td> <td style="text-align:right;"> 16.30 </td> </tr> <tr> <td style="text-align:left;"> Rwanda </td> <td style="text-align:right;"> 1997 </td> <td style="text-align:right;"> 7.21 </td> </tr> <tr> <td style="text-align:left;"> Rwanda </td> <td style="text-align:right;"> 2002 </td> <td style="text-align:right;"> 7.85 </td> </tr> <tr> <td style="text-align:left;"> Rwanda </td> <td style="text-align:right;"> 2007 </td> <td style="text-align:right;"> 8.86 </td> </tr> <tr> <td style="text-align:left;"> Syria </td> <td style="text-align:right;"> 1997 </td> <td style="text-align:right;"> 15.10 </td> </tr> <tr> <td style="text-align:left;"> Syria </td> <td style="text-align:right;"> 2002 </td> <td style="text-align:right;"> 17.20 </td> </tr> <tr> <td style="text-align:left;"> Syria </td> <td style="text-align:right;"> 2007 </td> <td style="text-align:right;"> 19.30 </td> </tr> </tbody> </table> ] .right-column[.font150[ 1. Draw the axes, add tick marks. 2. **Draw each bar.** Colour by country. 3. Add the axes labels. 4. Add a title. 5. Add a legend. ]] --- layout: true # How would you draw a graph? --- .left-column[ <table> <thead> <tr> <th style="text-align:left;"> country </th> <th style="text-align:right;"> year </th> <th style="text-align:right;"> pop </th> </tr> </thead> <tbody> <tr> <td style="text-align:left;"> Chile </td> <td style="text-align:right;"> 1997 </td> <td style="text-align:right;"> 14.60 </td> </tr> <tr> <td style="text-align:left;"> Chile </td> <td style="text-align:right;"> 2002 </td> <td style="text-align:right;"> 15.50 </td> </tr> <tr> <td style="text-align:left;"> Chile </td> <td style="text-align:right;"> 2007 </td> <td style="text-align:right;"> 16.30 </td> </tr> <tr> <td style="text-align:left;"> Rwanda </td> <td style="text-align:right;"> 1997 </td> <td style="text-align:right;"> 7.21 </td> </tr> <tr> <td style="text-align:left;"> Rwanda </td> <td style="text-align:right;"> 2002 </td> <td style="text-align:right;"> 7.85 </td> </tr> <tr> <td style="text-align:left;"> Rwanda </td> <td style="text-align:right;"> 2007 </td> <td style="text-align:right;"> 8.86 </td> </tr> <tr> <td style="text-align:left;"> Syria </td> <td style="text-align:right;"> 1997 </td> <td style="text-align:right;"> 15.10 </td> </tr> <tr> <td style="text-align:left;"> Syria </td> <td style="text-align:right;"> 2002 </td> <td style="text-align:right;"> 17.20 </td> </tr> <tr> <td style="text-align:left;"> Syria </td> <td style="text-align:right;"> 2007 </td> <td style="text-align:right;"> 19.30 </td> </tr> </tbody> </table> ] .right-column[.font150[ 1. What decisions did you make? 2. How did the data inform them? 3. Did you look at the values to decide the axes and tick marks? 4. How did you decide the labels? ]] --- --- layout: true # The grammar of graphics --- .left-column[ 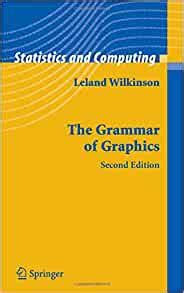 __Grammar of Graphics__ ] .right-column[ * Computers also follow steps. * The **grammar of graphics =** rules/steps for plotting. * First published in 1999. * Breaks down graphics into its constituent parts. * Focus on the relationship between the **variables** and the *visual properties* of the graph (e.g. *colour* = **country**). * Foundation for **ggplot2**, **tableau**, **vegalite** etc. ] --- layout: true # What is *ggplot2*? --- .left-column[  __Hadley Wickham__ ] .right-column[.font150[ * **gg**plot2 is the implementation of the **g**rammar of **g**raphics in R with some adaptations. * ..."a powerful way of thinking about visualisation, as a way of **mapping between variables and the visual properties of geometric objects** that you can perceive." ] .footnote[<http://disq.us/p/sv640d>] ] --- layout: true # Why use *ggplot2*? --- - Package for .hl[functional] data visualization. -- 1. Wrangle data -- 2. Map data to visual elements -- 3. Tweak scales, guides, axis, labels, theme -- - Once you know the syntax it is easy to -- - .hl[Reason] about how data drives visualization -- - .hl[Iterate] to create multiple visualizations -- - Be .hl[consistent] in the visualizations you make. --- layout: false # Learning objectives .left-column[ 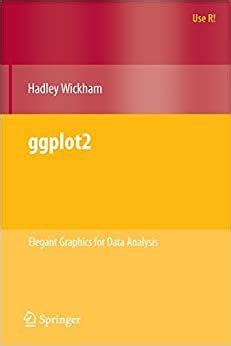 __ggplot2__ ] .right-column[.font150[ * `ggplot2` is a huge package with lots of options, but it's well documented and organized. * We'll cover a lot, but won't have time to go into every specific. * The aim is to **equip** you with **where** and **what** to look for. ]] --- layout: true # Getting started --- **Option 1**: install the metapackage [tidyverse](http://tidyverse.org) ```r install.packages('tidyverse') ``` **Option 2**: install just `ggplot2` ```r install.packages('ggplot2') ``` --- ## Load the tidyverse ```r library(tidyverse) ``` --- ## Other packages you'll need for this adventure * [gapminder](http://www.gapminder.org/data/) dataset from the [`gapminder` package](https://github.com/jennybc/gapminder) by Jenny Bryan. ```r ## install.packages("gapminder") library(gapminder) ``` --- layout: false class: inverse center middle text-white .font200[gg is for<br>Grammar of Graphics] --- # Every plot starts with data .left-code[ ### MPG Ratings of Cars - Manufacturer - Car Type (Class) - City MPG - Highway MPG ] .right-plot[ <table> <thead> <tr> <th style="text-align:left;"> manufacturer </th> <th style="text-align:left;"> class </th> <th style="text-align:right;"> cty </th> <th style="text-align:right;"> hwy </th> <th style="text-align:left;"> model </th> </tr> </thead> <tbody> <tr> <td style="text-align:left;"> audi </td> <td style="text-align:left;"> compact </td> <td style="text-align:right;"> 20 </td> <td style="text-align:right;"> 31 </td> <td style="text-align:left;"> a4 </td> </tr> <tr> <td style="text-align:left;"> audi </td> <td style="text-align:left;"> compact </td> <td style="text-align:right;"> 17 </td> <td style="text-align:right;"> 25 </td> <td style="text-align:left;"> a4 quattro </td> </tr> <tr> <td style="text-align:left;"> ford </td> <td style="text-align:left;"> suv </td> <td style="text-align:right;"> 12 </td> <td style="text-align:right;"> 18 </td> <td style="text-align:left;"> expedition 2wd </td> </tr> <tr> <td style="text-align:left;"> ford </td> <td style="text-align:left;"> suv </td> <td style="text-align:right;"> 13 </td> <td style="text-align:right;"> 19 </td> <td style="text-align:left;"> explorer 4wd </td> </tr> <tr> <td style="text-align:left;"> toyota </td> <td style="text-align:left;"> suv </td> <td style="text-align:right;"> 16 </td> <td style="text-align:right;"> 20 </td> <td style="text-align:left;"> 4runner 4wd </td> </tr> <tr> <td style="text-align:left;"> toyota </td> <td style="text-align:left;"> compact </td> <td style="text-align:right;"> 18 </td> <td style="text-align:right;"> 27 </td> <td style="text-align:left;"> camry solara </td> </tr> <tr> <td style="text-align:left;"> toyota </td> <td style="text-align:left;"> compact </td> <td style="text-align:right;"> 28 </td> <td style="text-align:right;"> 37 </td> <td style="text-align:left;"> corolla </td> </tr> <tr> <td style="text-align:left;"> toyota </td> <td style="text-align:left;"> suv </td> <td style="text-align:right;"> 13 </td> <td style="text-align:right;"> 18 </td> <td style="text-align:left;"> land cruiser wagon 4wd </td> </tr> </tbody> </table> ] --- layout: true # Guess the data behind this plot? --- .left-code[ ### MPG Ratings of Cars - Manufacturer - Car Type (Class) - City MPG - Highway MPG #### What variable is represented by point shape? ] .right-plot[ <img src="index_files/figure-html/guess-data-from-plot-2-1.png" width="100%" /> ] --- layout: true # Guess the data behind this plot? --- .left-code[ ### MPG Ratings of Cars - **Manufacturer** - Car Type (Class) - City MPG - Highway MPG #### What variable is represented by colour? ] .right-plot[ <img src="index_files/figure-html/guess-data-from-plot-3-1.png" width="100%" /> ] --- layout: true # Guess the data behind this plot? --- .left-code[ ### MPG Ratings of Cars - Manufacturer - **Car Type (Class)** - City MPG - Highway MPG #### What variable is represented on the x axis? ] .right-plot[ <img src="index_files/figure-html/guess-data-from-plot-1-1.png" width="100%" /> ] --- layout: true # Guess the data behind this plot? --- .left-code[ ### MPG Ratings of Cars - Manufacturer - Car Type (Class) - **City MPG** - Highway MPG #### What variable is on the Y axis? ] .right-plot[ <img src="index_files/figure-html/guess-data-from-plot-5-1.png" width="100%" /> ] --- layout: true # Guess the data behind this plot? --- .left-code[ ### MPG Ratings of Cars - Manufacturer - Car Type (Class) - City MPG - **Highway MPG** #### What is the title of the plot? ] .right-plot[ <img src="index_files/figure-html/guess-data-from-plot-6-1.png" width="100%" /> ] --- layout: true # Guess the data behind this plot? --- .left-code[ ### **MPG Ratings of Cars** - Manufacturer - Car Type (Class) - City MPG - Highway MPG ] .right-plot[ <img src="index_files/figure-html/guess-data-from-plot-7-1.png" width="100%" /> ] --- layout: false # How do we express visuals in words? .font120[ - **Data** to be visualized ] -- .font120[ - **.hlb[Aes]thetic mappings** from data to visual component ] -- .font120[ - **.hlb[Geom]etric objects** that appear on the plot ] -- .font120[ - **.hlb[Stat]istics** transform data on the way to visualization ] -- .font120[ - **.hlb[Coord]inates** organize location of geometric objects ] -- .font120[ - **.hlb[Scale]s** define the range of values for aesthetics ] -- .font120[ - **.hlb[Facet]s** group into subplots ] -- -- .font120[ - **.hlb[Theme]s** the visual elements of the plot not linked to the data ] --- layout: true # gg is for Grammar of Graphics .left-column[ ### Data ```r ggplot(data) ``` ] --- .right-column[ #### Tidy Data 1. Each **variable** forms a .hl[column] 2. Each **observation** forms a .hl[row] 3. Each **value** is a .hl[cell] ] -- .right-column[ #### Start by asking 1. What information do I want to use in my visualization? 1. Is that data contained in .hl[one column/row] for a given data point? ] --- .right-column[ <table> <thead> <tr> <th style="text-align:left;"> country </th> <th style="text-align:right;"> 1997 </th> <th style="text-align:right;"> 2002 </th> <th style="text-align:right;"> 2007 </th> </tr> </thead> <tbody> <tr> <td style="text-align:left;"> Chile </td> <td style="text-align:right;"> 14.599929 </td> <td style="text-align:right;"> 15.497046 </td> <td style="text-align:right;"> 16.284741 </td> </tr> <tr> <td style="text-align:left;"> Rwanda </td> <td style="text-align:right;"> 7.212583 </td> <td style="text-align:right;"> 7.852401 </td> <td style="text-align:right;"> 8.860588 </td> </tr> <tr> <td style="text-align:left;"> Syria </td> <td style="text-align:right;"> 15.081016 </td> <td style="text-align:right;"> 17.155814 </td> <td style="text-align:right;"> 19.314747 </td> </tr> </tbody> </table> ] -- .right-column[ ```r tidy_pop <- pivot_longer(data = messy_pop, cols = !country, names_to = "year", values_to = "pop") ``` <table> <thead> <tr> <th style="text-align:left;"> country </th> <th style="text-align:left;"> year </th> <th style="text-align:right;"> pop </th> </tr> </thead> <tbody> <tr> <td style="text-align:left;"> Chile </td> <td style="text-align:left;"> 1997 </td> <td style="text-align:right;"> 14.600 </td> </tr> <tr> <td style="text-align:left;"> Chile </td> <td style="text-align:left;"> 2002 </td> <td style="text-align:right;"> 15.497 </td> </tr> <tr> <td style="text-align:left;"> Chile </td> <td style="text-align:left;"> 2007 </td> <td style="text-align:right;"> 16.285 </td> </tr> <tr> <td style="text-align:left;"> Rwanda </td> <td style="text-align:left;"> 1997 </td> <td style="text-align:right;"> 7.213 </td> </tr> </tbody> </table> ] --- layout: true # gg is for Grammar of Graphics .left-column[ ### Data ### Aesthetics ```r + aes() ``` ] --- .right-column[ Map data to visual elements or parameters - year - pop - country <table> <thead> <tr> <th style="text-align:left;"> country </th> <th style="text-align:left;"> year </th> <th style="text-align:right;"> pop </th> </tr> </thead> <tbody> <tr> <td style="text-align:left;"> Chile </td> <td style="text-align:left;"> 1997 </td> <td style="text-align:right;"> 14.600 </td> </tr> <tr> <td style="text-align:left;"> Chile </td> <td style="text-align:left;"> 2002 </td> <td style="text-align:right;"> 15.497 </td> </tr> <tr> <td style="text-align:left;"> Chile </td> <td style="text-align:left;"> 2007 </td> <td style="text-align:right;"> 16.285 </td> </tr> <tr> <td style="text-align:left;"> Rwanda </td> <td style="text-align:left;"> 1997 </td> <td style="text-align:right;"> 7.213 </td> </tr> </tbody> </table> ] --- .right-column[ Map data to visual elements or parameters - year → **x** - pop → **y** - country → *shape*, *color*, etc. <table> <thead> <tr> <th style="text-align:left;"> country </th> <th style="text-align:left;"> year </th> <th style="text-align:right;"> pop </th> </tr> </thead> <tbody> <tr> <td style="text-align:left;"> Chile </td> <td style="text-align:left;"> 1997 </td> <td style="text-align:right;"> 14.600 </td> </tr> <tr> <td style="text-align:left;"> Chile </td> <td style="text-align:left;"> 2002 </td> <td style="text-align:right;"> 15.497 </td> </tr> <tr> <td style="text-align:left;"> Chile </td> <td style="text-align:left;"> 2007 </td> <td style="text-align:right;"> 16.285 </td> </tr> <tr> <td style="text-align:left;"> Rwanda </td> <td style="text-align:left;"> 1997 </td> <td style="text-align:right;"> 7.213 </td> </tr> </tbody> </table> ] --- .right-column[ Map data to visual elements or parameters ```r aes( x = year, y = pop, colour = country ) ``` ] --- layout: true # gg is for Grammar of Graphics .left-column[ ### Data ### Aesthetics ### Geoms ```r + geom_*() ``` ] --- .right-column[ Geometric objects displayed on the plot <img src="index_files/figure-html/geom_demo-1.png" width="650px" /> ] --- .right-column[ Here are the [some of the most widely used geoms](https://eric.netlify.com/2017/08/10/most-popular-ggplot2-geoms/) .font70.center[ | Type | Function | |:----:|:--------:| | Point | `geom_point()` | | Line | `geom_line()` | | Bar | `geom_bar()`, `geom_col()` | | Histogram | `geom_histogram()` | | Regression | `geom_smooth()` | | Boxplot | `geom_boxplot()` | | Text | `geom_text()` | | Vert./Horiz. Line | `geom_{vh}line()` | | Count | `geom_count()` | | Density | `geom_density()` | <https://eric.netlify.com/2017/08/10/most-popular-ggplot2-geoms/> ] ] --- .right-column[ See <http://ggplot2.tidyverse.org/reference/> for many more options .font70[ ``` ## [1] "geom_abline" "geom_area" "geom_bar" ## [4] "geom_bin2d" "geom_blank" "geom_boxplot" ## [7] "geom_col" "geom_contour" "geom_contour_filled" ## [10] "geom_count" "geom_crossbar" "geom_curve" ## [13] "geom_density" "geom_density_2d" "geom_density_2d_filled" ## [16] "geom_density2d" "geom_density2d_filled" "geom_dotplot" ## [19] "geom_errorbar" "geom_errorbarh" "geom_freqpoly" ## [22] "geom_function" "geom_hex" "geom_histogram" ## [25] "geom_hline" "geom_jitter" "geom_label" ## [28] "geom_line" "geom_linerange" "geom_map" ## [31] "geom_path" "geom_point" "geom_pointrange" ## [34] "geom_polygon" "geom_qq" "geom_qq_line" ## [37] "geom_quantile" "geom_raster" "geom_rect" ## [40] "geom_ribbon" "geom_rug" "geom_segment" ## [43] "geom_sf" "geom_sf_label" "geom_sf_text" ## [46] "geom_smooth" "geom_spoke" "geom_step" ## [49] "geom_text" "geom_tile" "geom_violin" ## [52] "geom_vline" ``` ] ] --- .right-column[ <img src="images/geom.gif" width="250px" style="float: right; margin-right: 100px; margin-top: 0px;"> Or just start typing `geom_` in RStudio ] --- layout: true # Our first plot! --- .left-code[ ```r ggplot(tidy_pop) ``` ] .right-plot[ <img src="index_files/figure-html/first-plot1a-1.png" width="100%" /> ] --- .left-code[ ```r ggplot(tidy_pop, * aes(x = year, * y = pop) ) ``` ] .right-plot[ <img src="index_files/figure-html/first-plot1b-1.png" width="100%" /> ] --- .left-code[ ```r ggplot(tidy_pop, aes(x = year, y = pop) ) + * geom_point() ``` ] .right-plot[ <img src="index_files/figure-html/first-plot1c-1.png" width="100%" /> ] --- .left-code[ ```r ggplot(tidy_pop, aes(x = year, y = pop, * color = country) ) + geom_point() ``` ] .right-plot[ <img src="index_files/figure-html/first-plot1-1.png" width="100%" /> ] --- .left-code[ ```r ggplot(tidy_pop, aes(x = year, y = pop, color = country) ) + geom_point() + * geom_line() ``` .font80[ ```r geom_path: Each group consists of only one observation. Do you need to adjust the group aesthetic? ``` ] ] .right-plot[ <img src="index_files/figure-html/first-plot2-fake-1.png" width="100%" /> ] --- .left-code[ ```r ggplot(tidy_pop, aes(x = year, y = pop, color = country) ) + geom_point() + geom_line( * aes(group = country)) ``` ] .right-plot[ <img src="index_files/figure-html/first-plot2-1.png" width="100%" /> ] --- .left-code[ ```r *g <- ggplot(tidy_pop, aes(x = year, y = pop, color = country) ) + geom_point() + geom_line( aes(group = country)) *g ``` ] .right-plot[ <img src="index_files/figure-html/first-plot3-1.png" width="100%" /> ] --- layout: true # gg is for Grammar of Graphics .left-column[ ### Data ### Aesthetics ### Geoms ```r + geom_*() ``` ] --- .right-column[ ```r geom_*(mapping = aes(), data, stat, position) ``` - `data` Geoms can have their own data - Has to map onto global coordinates - `aes` Geoms can have their own aesthetics - Inherits global aesthetics - Have geom-specific aesthetics - `geom_point` needs `x` and `y`, optional `shape`, `color`, `size`, etc. - `geom_ribbon` requires `x`, `ymin` and `ymax`, optional `fill` - Use `?` to find out the aesthetics required and the ones you can change: `?geom_ribbon` ] --- .right-column[ ```r geom_*(mapping, data, stat, position) ``` - `stat` Some geoms apply further transformations to the data - All respect `stat = 'identity'` - Ex: `geom_histogram` uses `stat_bin()` to group observations - `position` Some adjust location of objects - `'dodge'`, `'stack'`, `'jitter'` ] --- layout: true # Our first plot! --- .left-code[ ```r g <- ggplot() + geom_point( * data = tidy_pop, * aes(x = year, * y = pop, * color = country) ) + geom_line( * data = tidy_pop, * aes(x = year, * y = pop, * color = country, * group = country) ) g ``` ] .right-plot[ <img src="index_files/figure-html/first-plot-geom-1-1.png" width="100%" /> ] --- layout: true # gg is for Grammar of Graphics .left-column[ ### Data ### Aesthetics ### Geoms ```r + geom_*() ``` ] --- .right-column[ ```r geom_*(mapping = aes(), data, stat, position) ``` - `data` Geoms can have their own data - Has to map onto global coordinates .font150[What would the advantage be for a geom to have their own data?] ] --- layout: true # gg is for Grammar of Graphics .left-column[ ### Data ### Aesthetics ### Geoms ### Facet ```r +facet_wrap() +facet_grid() ``` ] --- .right-plot[ ```r g + facet_wrap(~ country) ``` <img src="index_files/figure-html/geom_facet-1.png" width="90%" /> ] --- .right-column[ ```r g + facet_grid(continent ~ country) ``` <img src="index_files/figure-html/geom_grid-1.png" width="90%" /> ] --- layout: true # gg is for Grammar of Graphics .left-column[ ### Data ### Aesthetics ### Geoms ### Facet ### Labels ```r + labs() ``` ] --- .right-column[ ```r (g <- g + labs(x = "Year", y = "Population (millions)")) ``` <img src="index_files/figure-html/labs-ex-1.png" width="90%" /> ] --- layout: true # gg is for Grammar of Graphics .left-column[ ### Data ### Aesthetics ### Geoms ### Facet ### Labels ### Coords ```r + coord_*() ``` ] --- .right-column[ ```r g + coord_flip() ``` <img src="index_files/figure-html/coord-ex-1.png" width="90%" /> ] --- layout: true # gg is for Grammar of Graphics .left-column[ ### Data ### Aesthetics ### Geoms ### Facet ### Labels ### Coords ### Scales ```r + scale_*_*() ``` ] --- .right-column[ `scale` + `_` + `<aes>` + `_` + `<type>` + `()` `<aes>` = parameter to adjust; `<type>` = Parameter Type ] -- .right-column[ - I want to use a different color palette<br>`scale_fill_discrete()`<br>`scale_color_continuous()` ] -- .right-column[ - I want to rescale y-axis as log<br>`scale_y_log10()` ] -- .right-column[ - I want to change my discrete x-axis<br>`scale_x_discrete()` ] --- .right-column[ ```r g + scale_color_manual(values = c("peru", "pink", "plum")) ``` <img src="index_files/figure-html/scale_ex1-1.png" width="90%" /> ] --- .right-column[ ```r g + scale_y_log10() ``` <img src="index_files/figure-html/scale_ex2-1.png" width="90%" /> ] --- .right-column[ ```r g + scale_x_discrete(labels = c("MCMXCVII", "MMII", "MMVII")) ``` <img src="index_files/figure-html/scale_ex4-1.png" width="90%" /> ] --- layout: true # gg is for Grammar of Graphics .left-column[ ### Data ### Aesthetics ### Geoms ### Facet ### Labels ### Coords ### Scales ### Theme ```r + theme() ``` ] --- .right-column[ Change the appearance of plot decorations<br> i.e. things that aren't mapped to data A few "starter" themes ship with the package - `g + theme_bw()` - `g + theme_dark()` - `g + theme_gray()` - `g + theme_light()` - `g + theme_minimal()` ] --- .right-column[ ```r g + theme_bw() ``` <img src="index_files/figure-html/theme_ex1-1.png" width="90%" /> ] --- .right-column[ Huge number of parameters, grouped by plot area: - Global options: `line`, `rect`, `text`, `title` - `axis`: x-, y- or other axis title, ticks, lines - `legend`: Plot legends - `panel`: Actual plot area - `plot`: Whole image - `strip`: Facet labels ] --- .right-column[ Theme options are supported by helper functions: - `element_blank()` removes the element - `element_line()` - `element_rect()` - `element_text()` ] --- .right-column[ .font80[ ```r g + theme_bw() + theme(text = element_text(colour = "hotpink", size = 20)) ``` <img src="index_files/figure-html/unnamed-chunk-1-1.png" width="90%" /> ] ] --- .right-column[ You can also set the theme globally with `theme_set()` ```r my_theme <- theme_bw() + theme( text = element_text(family = "Palatino", size = 12), panel.border = element_rect(colour = 'grey80'), panel.grid.minor = element_blank() ) theme_set(my_theme) ``` All plots will now use this theme! ] --- .right-column[ ```r g + theme(legend.position = 'bottom') ``` <img src="index_files/figure-html/unnamed-chunk-2-1.png" width="90%" /> ] --- layout: false # Save Your Work To save your plot, use **ggsave**. ```r ggsave( filename = "my_plot.png", plot = my_plot, width = 10, height = 8, dpi = 100, device = "png" ) ``` --- layout: false class: inverse center middle text-white .font200[You have the power!] --- layout: false # Exercises Add the title "Life Expectancy in the Americas 1952 vs 2007" using `ggtitle()`. .left-code[ ```r gapminder %>% filter(continent == "Americas", year %in% c(1952, 2007)) %>% mutate(year = as.factor(year)) %>% ggplot() + geom_point(mapping = aes(y = country, x = lifeExp, colour = year)) + labs(x = "Life Expectancy", y = "Country", colour = "Year") ``` <div class="countdown" id="timer_613a7d94" style="right:0;bottom:0;" data-warnwhen="0"> <code class="countdown-time"><span class="countdown-digits minutes">02</span><span class="countdown-digits colon">:</span><span class="countdown-digits seconds">00</span></code> </div> ] .right-plot[ 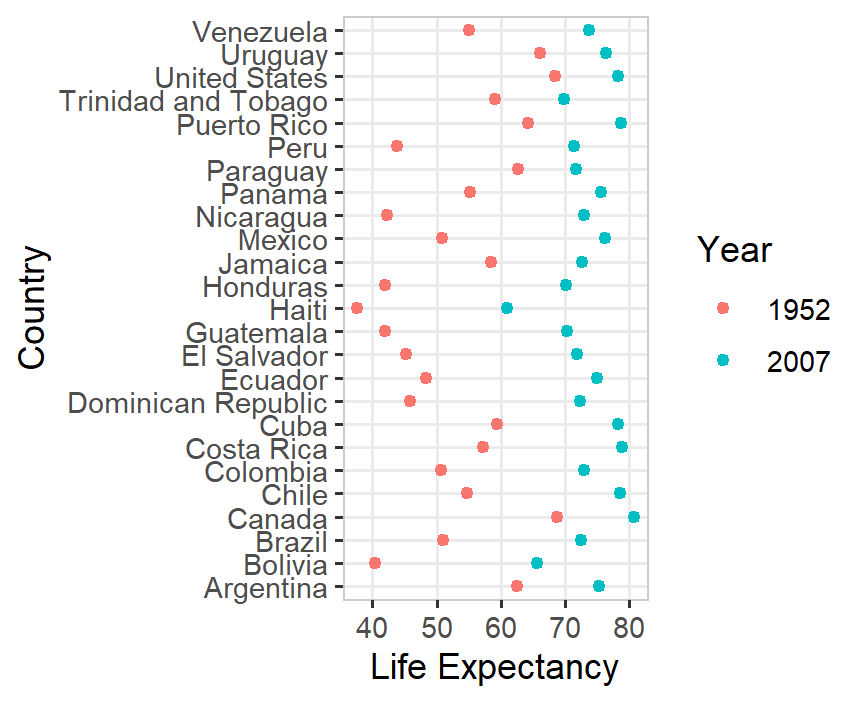 ] --- layout: false # Exercises Add the title "Life Expectancy in the Americas 1952 vs 2007" using `ggtitle()`. .left-code[ ```r gapminder %>% filter(continent == "Americas", year %in% c(1952, 2007)) %>% mutate(year = as.factor(year)) %>% ggplot() + geom_point(mapping = aes(y = country, x = lifeExp, colour = year)) + labs(x = "Life Expectancy", y = "Country", colour = "Year") + * ggtitle("Life Expectancy in the Americas 1952 vs 2007") ``` ] .right-plot[ 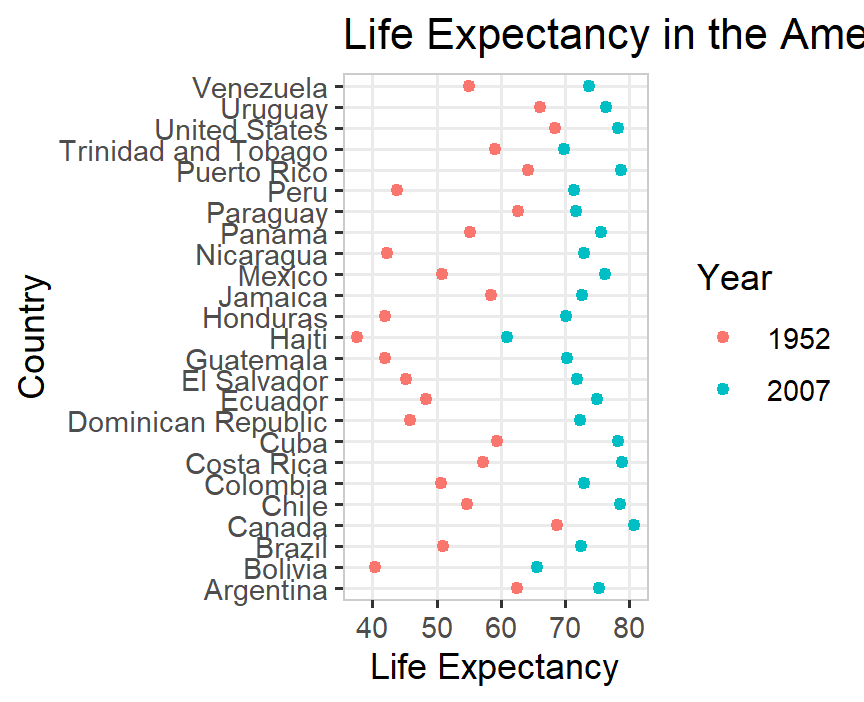 ] --- layout: false # Exercises What does fct_reorder and coord_flip do? Try removing them. .left-code[ ```r gap_lifeExpdiff_df <- gapminder %>% group_by(country) %>% summarise(life_exp_diff = max(lifeExp) - min(lifeExp)) %>% top_n(n = 5) p1 <- ggplot(gap_lifeExpdiff_df) + geom_col(mapping = aes(x = fct_reorder(country, life_exp_diff), y = life_exp_diff), fill = "blue") + labs(y = "Difference in Life Expectancy", x = "") + ggtitle("Difference in Life Expectancy", sub = "Top 5 countries with the largest difference (1952-2007)") + ylim(0, 40) p1 + coord_flip() ``` <div class="countdown" id="timer_613a7bd7" style="right:0;bottom:0;" data-warnwhen="0"> <code class="countdown-time"><span class="countdown-digits minutes">02</span><span class="countdown-digits colon">:</span><span class="countdown-digits seconds">00</span></code> </div> ] .right-plot[ 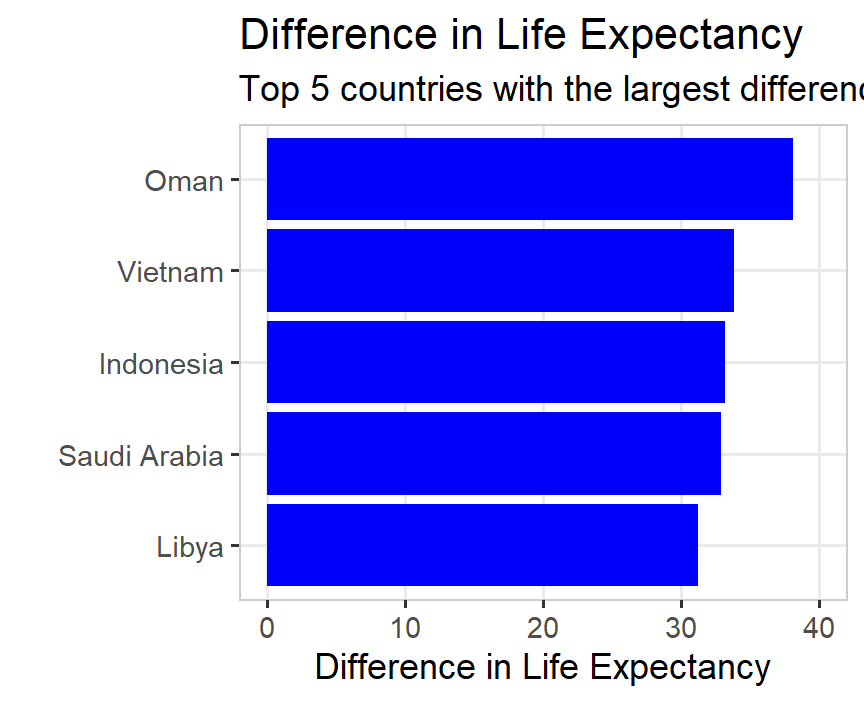 ] * Rerun the plot, this time removing `coord_flip()`. What does the function `coord_flip()` change in the plot? --- layout: false # Exercises Try recreating the following plot by filling in the blanks below .left-code[ ```r gapminder %>% filter(country %in% c("Argentina", "Chile", "Peru", "Uruguay")) %>% select(year, pop, country) %>% mutate(pop = pop/10^6) %>% ggplot() + geom_point(mapping = aes(x = BLANK, y = BLANK, colour = BLANK)) + facet_wrap(country ~ .) + ggtitle("Population over time") + labs(x = "Year", y = "Population in Millions", colour = "Country") ``` <div class="countdown" id="timer_613a7dda" style="right:0;bottom:0;" data-warnwhen="0"> <code class="countdown-time"><span class="countdown-digits minutes">03</span><span class="countdown-digits colon">:</span><span class="countdown-digits seconds">00</span></code> </div> ] .right-plot[ 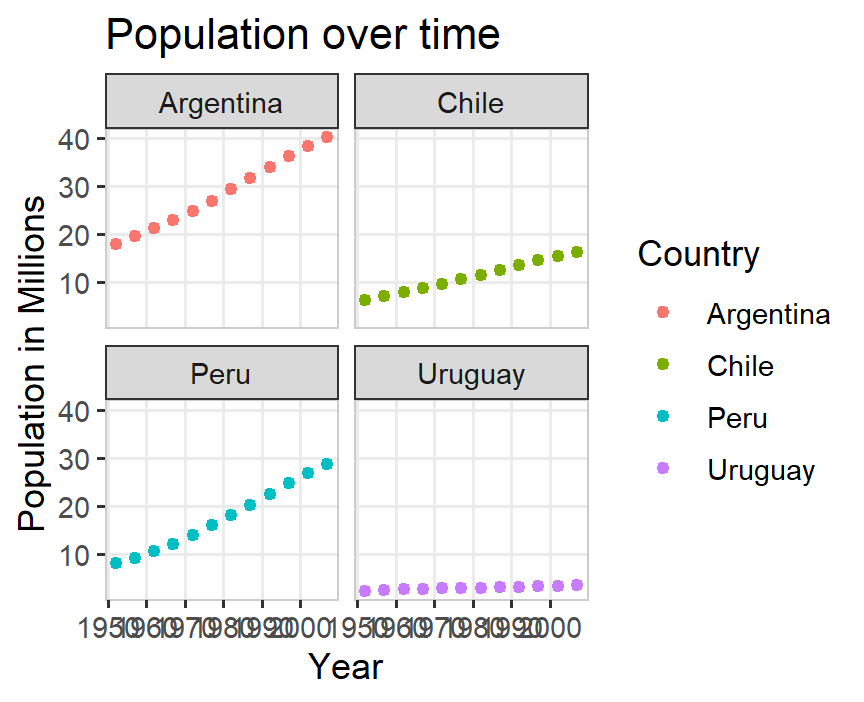 ] --- layout: false # Exercises .left-code[ ```r gapminder %>% filter(country %in% c("Argentina", "Chile", "Peru", "Uruguay")) %>% select(year, pop, country) %>% mutate(pop = pop/10^6) %>% ggplot() + geom_point(mapping = aes(x = year, y = pop, colour = country)) + facet_wrap(country ~ .) + ggtitle("Population over time") + labs(x = "Year", y = "Population in Millions", colour = "Country") ``` ] .right-plot[  ] --- layout: false # Exercises: What's the relationship between Population and Year by continent? Fill in the blanks to find out. ```r gapminder %>% ggplot() + geom_line(mapping = aes(x = year, y = BLANK, group = country, colour = BLANK)) + labs(y = "Populations (Millions)", x = "Year", colour = "Continent") + facet_wrap(. ~ BLANK) ``` <div class="countdown" id="timer_613a7e81" style="right:0;bottom:0;" data-warnwhen="0"> <code class="countdown-time"><span class="countdown-digits minutes">03</span><span class="countdown-digits colon">:</span><span class="countdown-digits seconds">00</span></code> </div> --- layout: false # Exercises What's the relationship between Population and Year by continent? ```r gapminder %>% ggplot() + geom_line(mapping = aes(x = year, * y = pop/10^6, group = country, * colour = continent)) + labs(y = "Populations (Millions)", x = "Year", colour = "Continent") + * facet_wrap(. ~ continent) ``` --- layout: false # Exercises What's the relationship between Population and Year by continent? <img src="index_files/figure-html/What is the relationship between population and year by continent solution plot-1.png" width="100%" /> --- class: inverse, center, middle # "Live" Coding ```r library(gapminder) ``` --- # head(gapminder) <div class="kable-table"> <table> <thead> <tr> <th style="text-align:left;"> country </th> <th style="text-align:left;"> continent </th> <th style="text-align:right;"> year </th> <th style="text-align:right;"> lifeExp </th> <th style="text-align:right;"> pop </th> <th style="text-align:right;"> gdpPercap </th> </tr> </thead> <tbody> <tr> <td style="text-align:left;"> Afghanistan </td> <td style="text-align:left;"> Asia </td> <td style="text-align:right;"> 1952 </td> <td style="text-align:right;"> 28.801 </td> <td style="text-align:right;"> 8425333 </td> <td style="text-align:right;"> 779.4453 </td> </tr> <tr> <td style="text-align:left;"> Afghanistan </td> <td style="text-align:left;"> Asia </td> <td style="text-align:right;"> 1957 </td> <td style="text-align:right;"> 30.332 </td> <td style="text-align:right;"> 9240934 </td> <td style="text-align:right;"> 820.8530 </td> </tr> <tr> <td style="text-align:left;"> Afghanistan </td> <td style="text-align:left;"> Asia </td> <td style="text-align:right;"> 1962 </td> <td style="text-align:right;"> 31.997 </td> <td style="text-align:right;"> 10267083 </td> <td style="text-align:right;"> 853.1007 </td> </tr> <tr> <td style="text-align:left;"> Afghanistan </td> <td style="text-align:left;"> Asia </td> <td style="text-align:right;"> 1967 </td> <td style="text-align:right;"> 34.020 </td> <td style="text-align:right;"> 11537966 </td> <td style="text-align:right;"> 836.1971 </td> </tr> <tr> <td style="text-align:left;"> Afghanistan </td> <td style="text-align:left;"> Asia </td> <td style="text-align:right;"> 1972 </td> <td style="text-align:right;"> 36.088 </td> <td style="text-align:right;"> 13079460 </td> <td style="text-align:right;"> 739.9811 </td> </tr> <tr> <td style="text-align:left;"> Afghanistan </td> <td style="text-align:left;"> Asia </td> <td style="text-align:right;"> 1977 </td> <td style="text-align:right;"> 38.438 </td> <td style="text-align:right;"> 14880372 </td> <td style="text-align:right;"> 786.1134 </td> </tr> </tbody> </table> </div> --- # glimpse(gapminder) ``` Rows: 1,704 Columns: 6 $ country <fct> Afghanistan, Afghanistan, Afghanistan, Afghanistan, Afghanistan, Af... $ continent <fct> Asia, Asia, Asia, Asia, Asia, Asia, Asia, Asia, Asia, Asia, Asia, A... $ year <int> 1952, 1957, 1962, 1967, 1972, 1977, 1982, 1987, 1992, 1997, 2002, 2... $ lifeExp <dbl> 28.801, 30.332, 31.997, 34.020, 36.088, 38.438, 39.854, 40.822, 41.... $ pop <int> 8425333, 9240934, 10267083, 11537966, 13079460, 14880372, 12881816,... $ gdpPercap <dbl> 779.4453, 820.8530, 853.1007, 836.1971, 739.9811, 786.1134, 978.011... ``` -- Let's start with `lifeExp` vs `gdpPercap` --- class: fullscreen layout: true --- .left-code[ ```r ggplot(gapminder, aes(x = gdpPercap, y = lifeExp)) ``` ] .right-plot[ 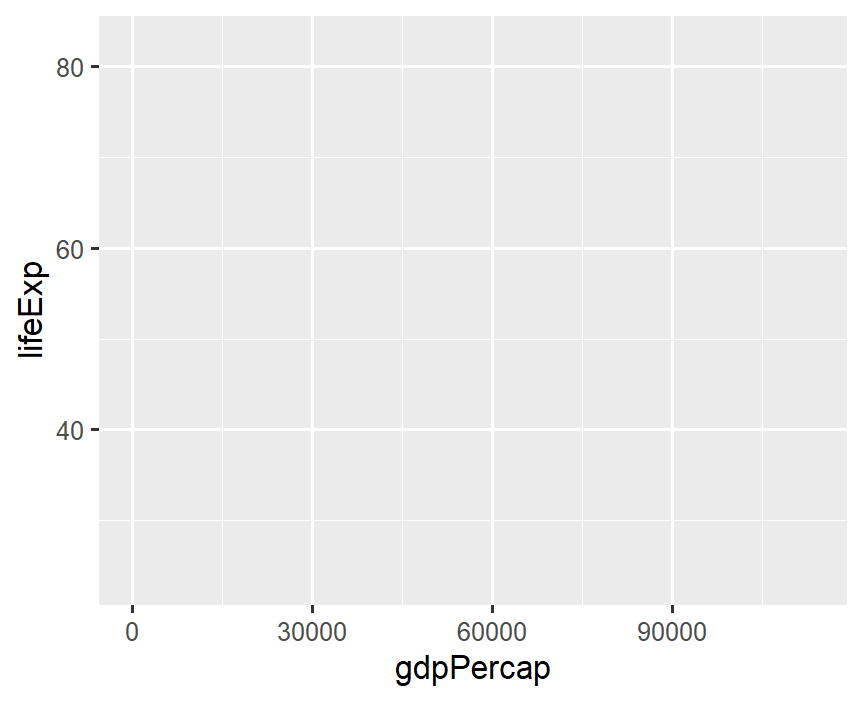 ] -- Add points... --- .left-code[ ```r ggplot(gapminder, aes(x = gdpPercap, y = lifeExp)) + * geom_point() ``` ] .right-plot[ 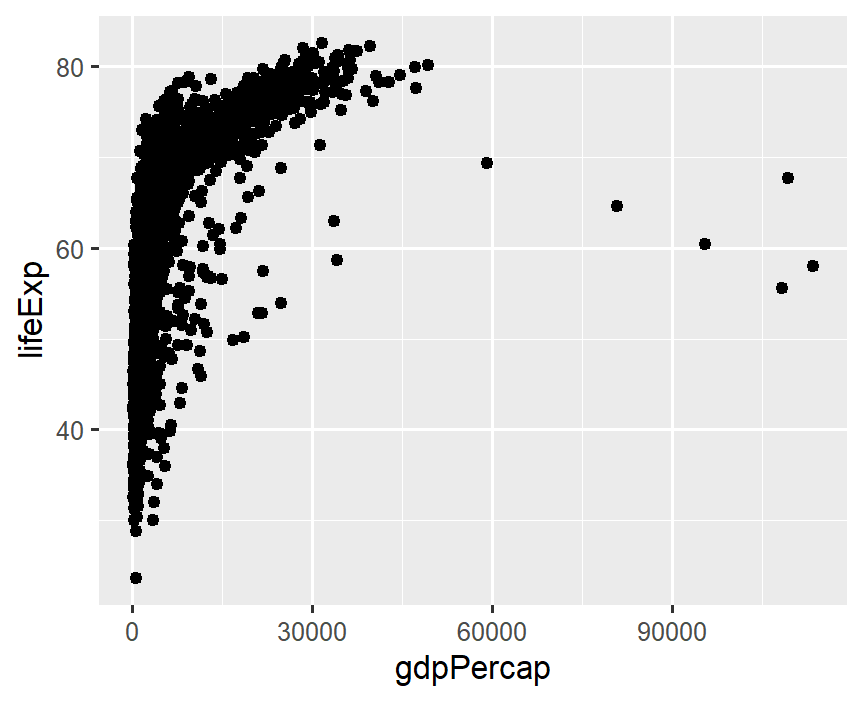 ] -- How can I tell the continents apart? --- .left-code[ ```r ggplot(gapminder, aes(x = gdpPercap, y = lifeExp, * color = continent)) + geom_point() ``` ] .right-plot[ 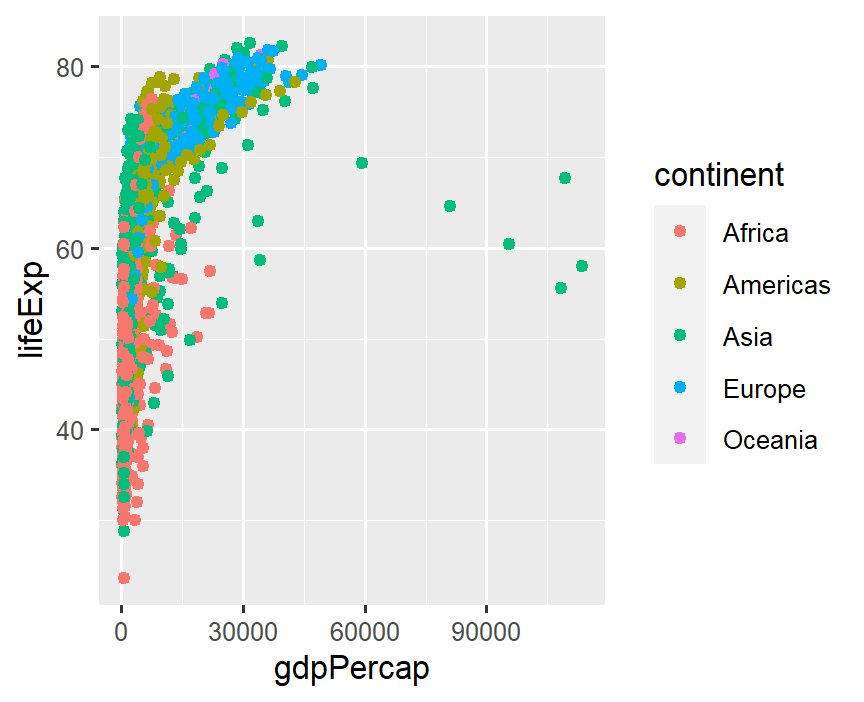 ] -- GDP is squished together on the left --- .left-code[ ```r ggplot(gapminder, aes(x = gdpPercap, y = lifeExp, color = continent)) + geom_point() + * scale_x_log10() ``` ] .right-plot[ 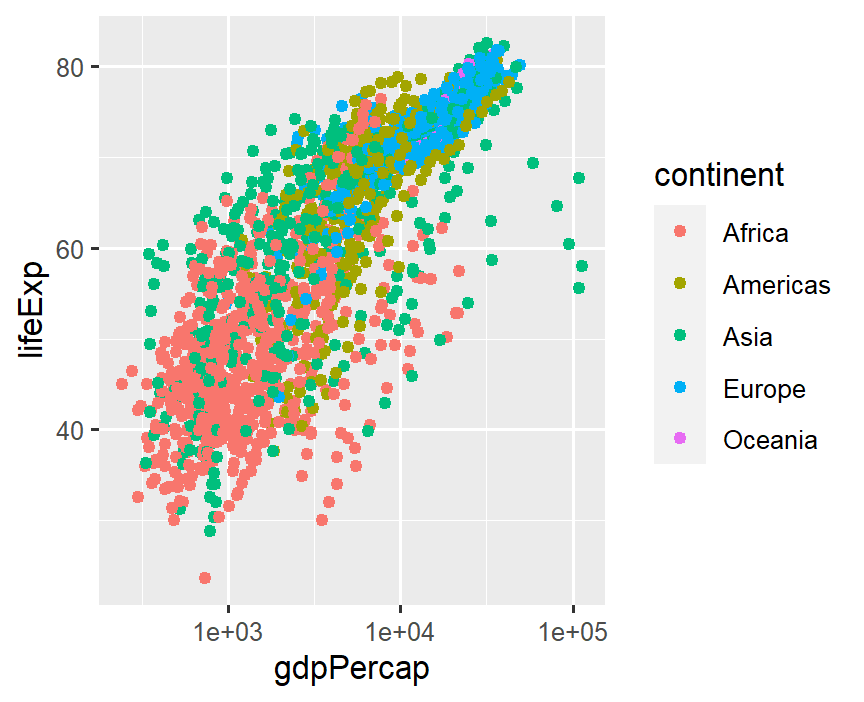 ] -- Still lots of overlap in the countries... --- .left-code[ ```r ggplot(gapminder, aes(x = gdpPercap, y = lifeExp, color = continent)) + geom_point() + scale_x_log10() + * facet_wrap(~ continent) + * guides(color = FALSE) ``` No need for color legend thanks to facet titles ] .right-plot[ 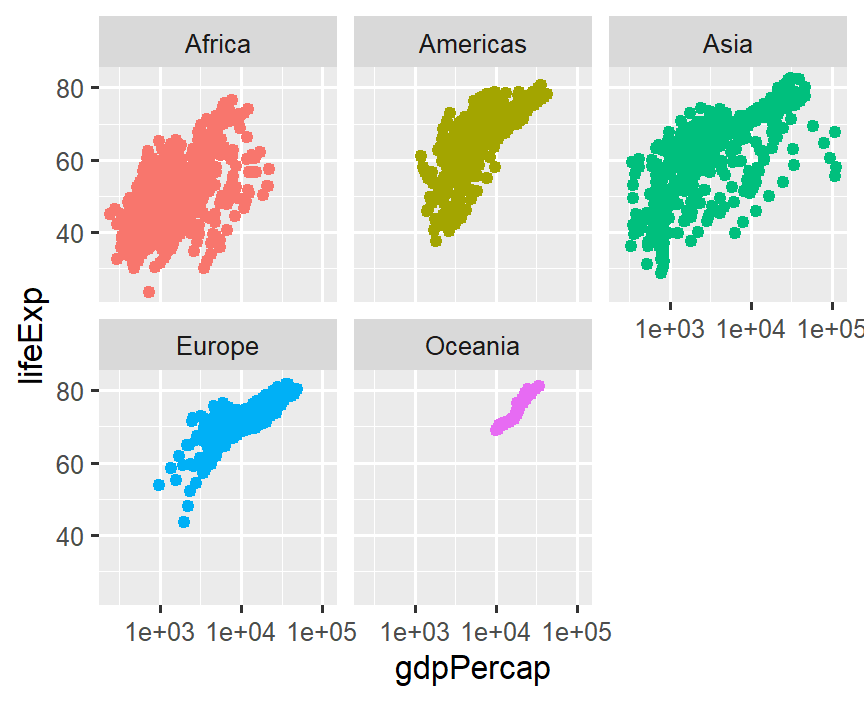 ] -- Lots of overplotting due to point size --- .left-code[ ```r ggplot(gapminder, aes(x = gdpPercap, y = lifeExp, color = continent)) + * geom_point(size = 0.25) + scale_x_log10() + facet_wrap(~ continent) + guides(color = FALSE) ``` ] .right-plot[ 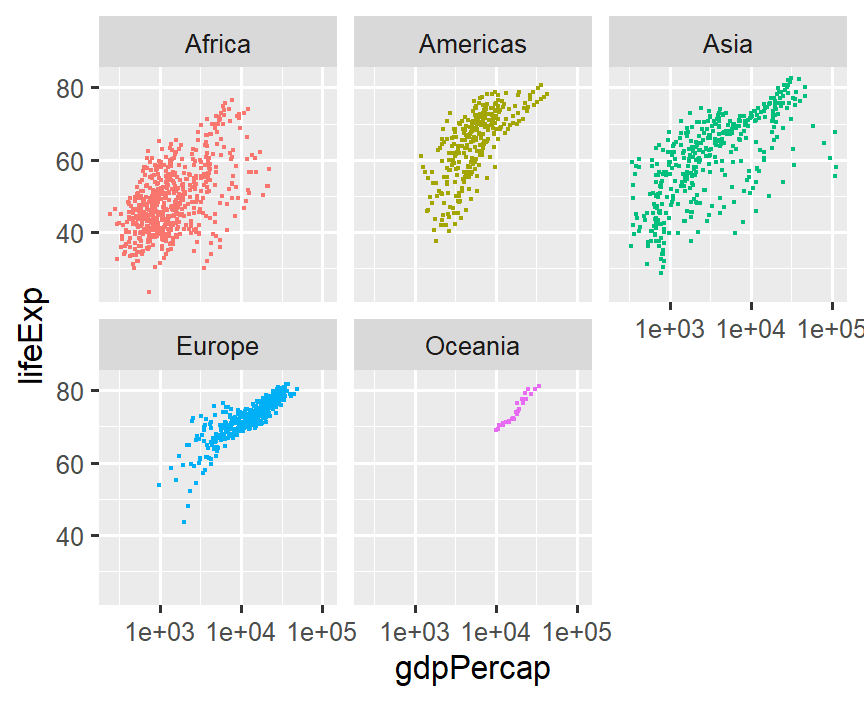 ] -- Is there a trend? --- .left-code[ ```r ggplot(gapminder, aes(x = gdpPercap, y = lifeExp, color = continent)) + * geom_line() + #geom_point(size = 0.25) + scale_x_log10() + facet_wrap(~ continent) + guides(color = FALSE) ``` ] .right-plot[ 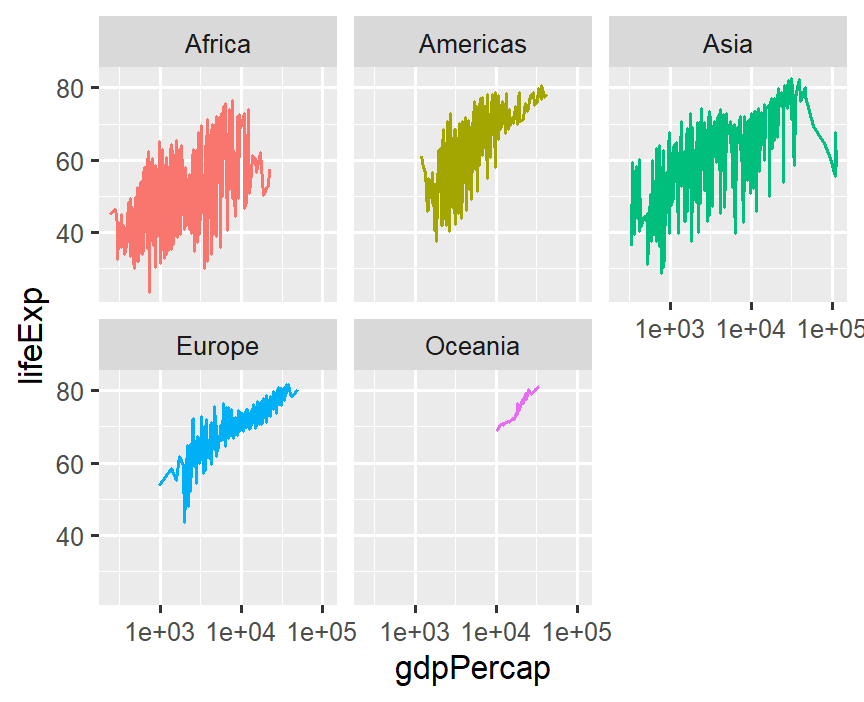 ] -- Okay, that line just connected all of the points sequentially... --- .left-code[ ```r ggplot(gapminder, aes(x = gdpPercap, y = lifeExp, color = continent)) + geom_line( * aes(group = country) ) + #geom_point(size = 0.25) + scale_x_log10() + facet_wrap(~ continent) + guides(color = FALSE) ``` .font200.center[🤔] ] .right-plot[ 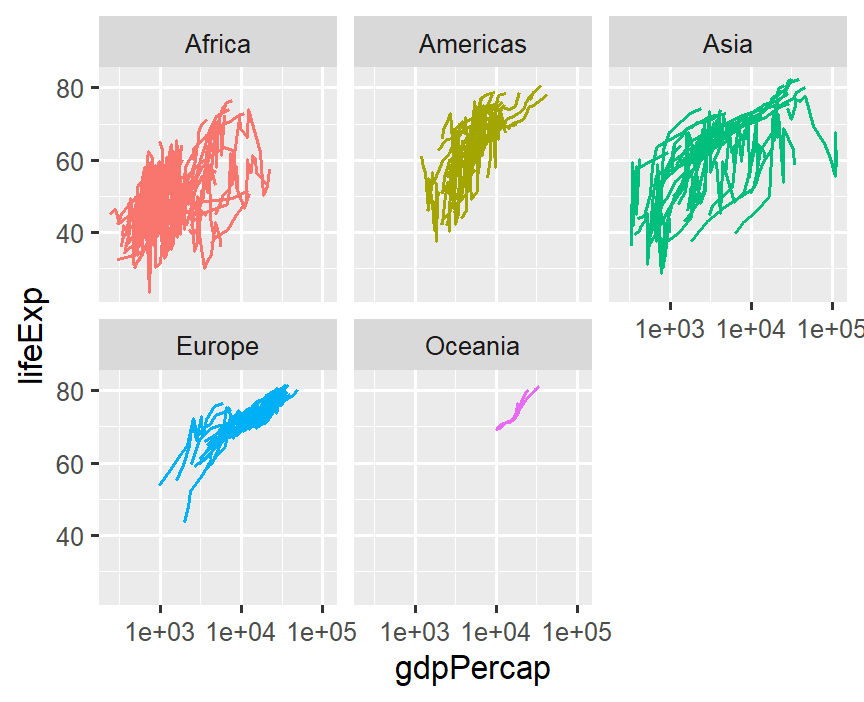 ] -- 💡 We need time on x-axis! --- .left-code[ ```r ggplot(gapminder, * aes(x = year, * y = gdpPercap, color = continent)) + geom_line( aes(group = country)) + #geom_point(size = 0.25) + * scale_y_log10() + facet_wrap(~ continent) + guides(color = FALSE) ``` ] .right-plot[ 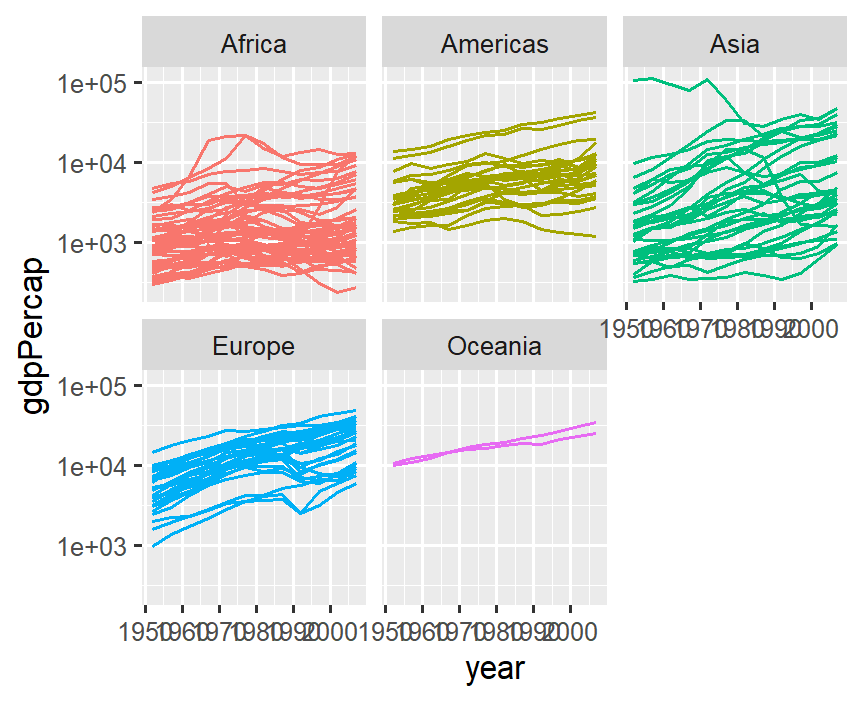 ] -- Can't see x-axis labels, though --- .left-code[ ```r ggplot(gapminder, aes(x = year, y = gdpPercap, color = continent)) + geom_line( aes(group = country)) + #geom_point(size = 0.25) + scale_y_log10() + * scale_x_continuous(breaks = * seq(1950, 2000, 25) * ) + facet_wrap(~ continent) + guides(color = FALSE) ``` ] .right-plot[ 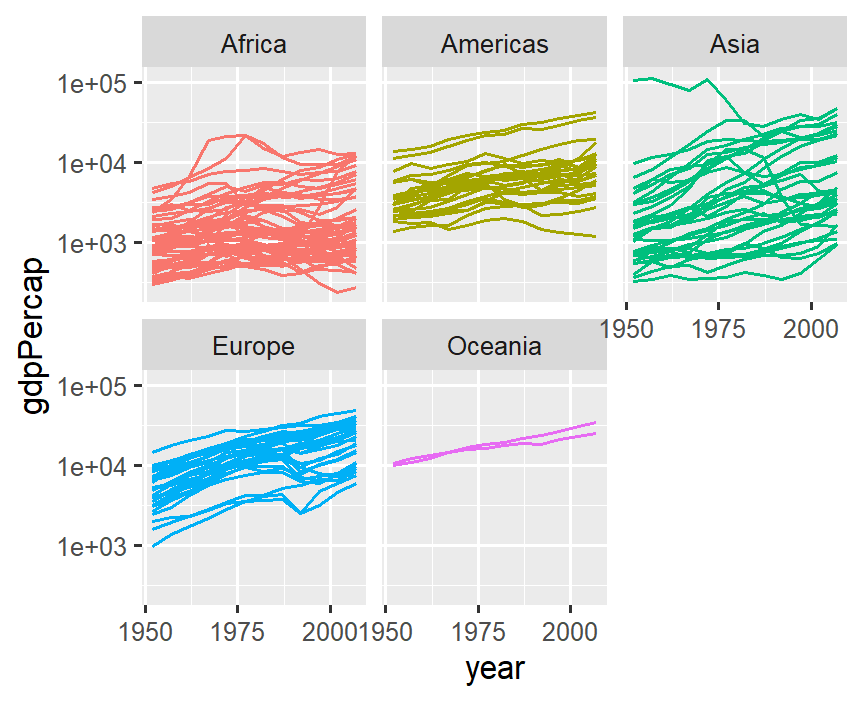 ] -- What about life expectancy? --- .left-code[ ```r ggplot(gapminder, aes(x = year, * y = lifeExp, color = continent)) + geom_line( aes(group = country)) + #geom_point(size = 0.25) + * #scale_y_log10() + scale_x_continuous(breaks = seq(1950, 2000, 25)) + facet_wrap(~ continent) + guides(color = FALSE) ``` ] .right-plot[ 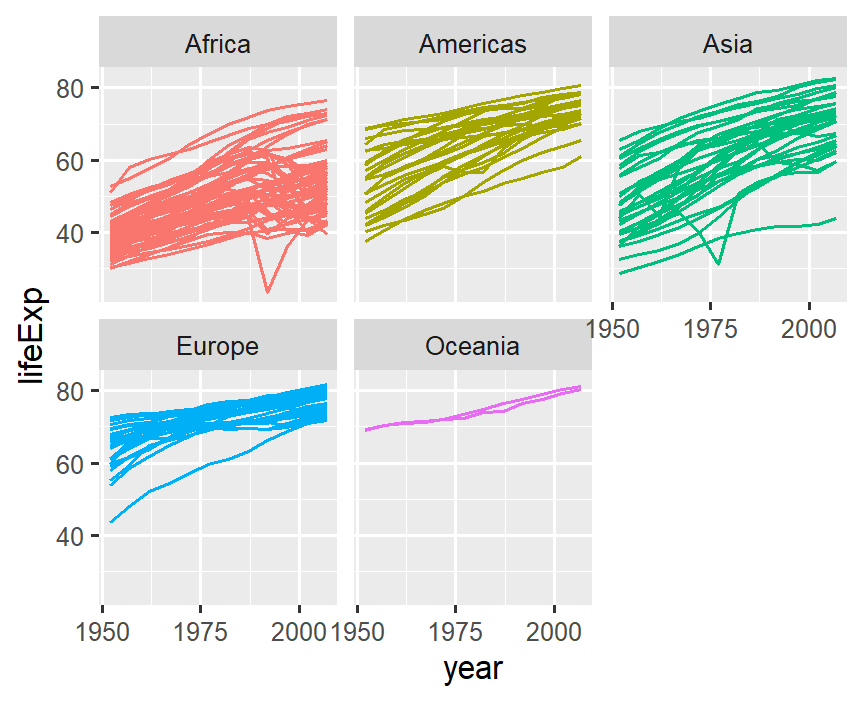 ] -- Okay, let's add a trend line --- .left-code[ ```r ggplot(gapminder, aes(x = year, y = lifeExp, color = continent)) + geom_line( aes(group = country)) + # geom_point(size = 0.25) + * geom_smooth() + scale_x_continuous(breaks = seq(1950, 2000, 25)) + facet_wrap(~ continent) + guides(color = FALSE) ``` ] .right-plot[ 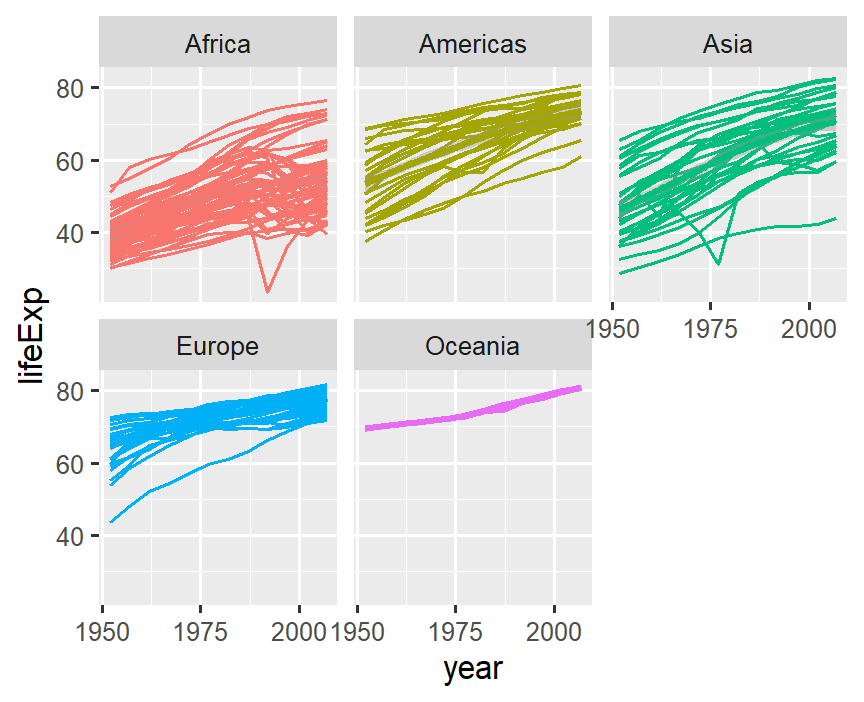 ] -- De-emphasize individual countries --- .left-code[ ```r ggplot(gapminder, aes(x = year, y = lifeExp, color = continent)) + geom_line( aes(group = country), * alpha = 0.2) + #geom_point(size = 0.25) + geom_smooth() + scale_x_continuous(breaks = seq(1950, 2000, 25)) + facet_wrap(~ continent) + guides(color = FALSE) ``` ] .right-plot[ 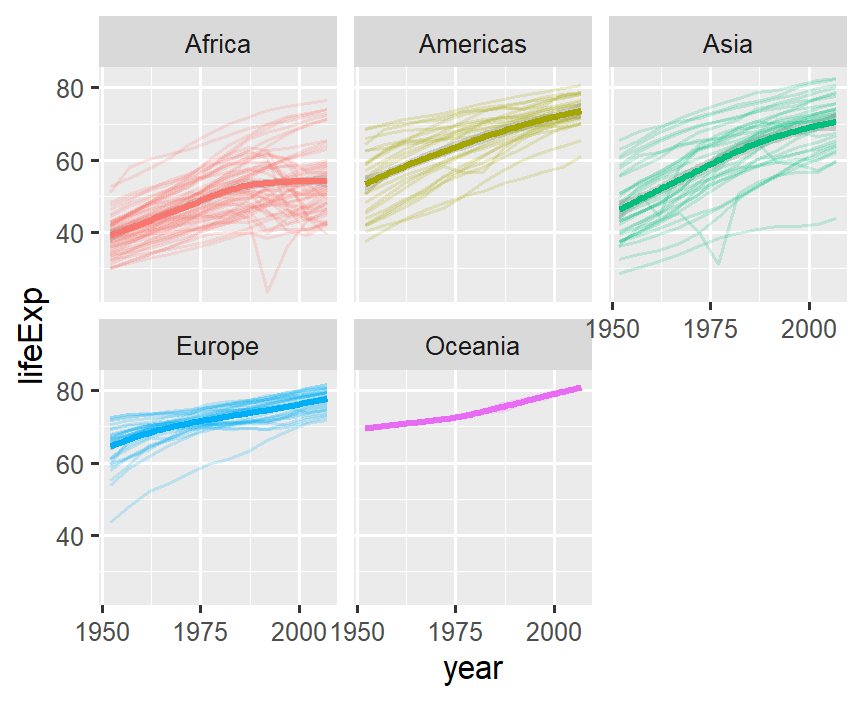 ] -- Let's compare continents --- .left-code[ ```r ggplot(gapminder, aes(x = year, y = lifeExp, color = continent)) + geom_line( aes(group = country), alpha = 0.2) + geom_smooth() + # scale_x_continuous( # breaks = # seq(1950, 2000, 25))+ * # facet_wrap(~ continent) + guides(color = FALSE) ``` ] .right-plot[ 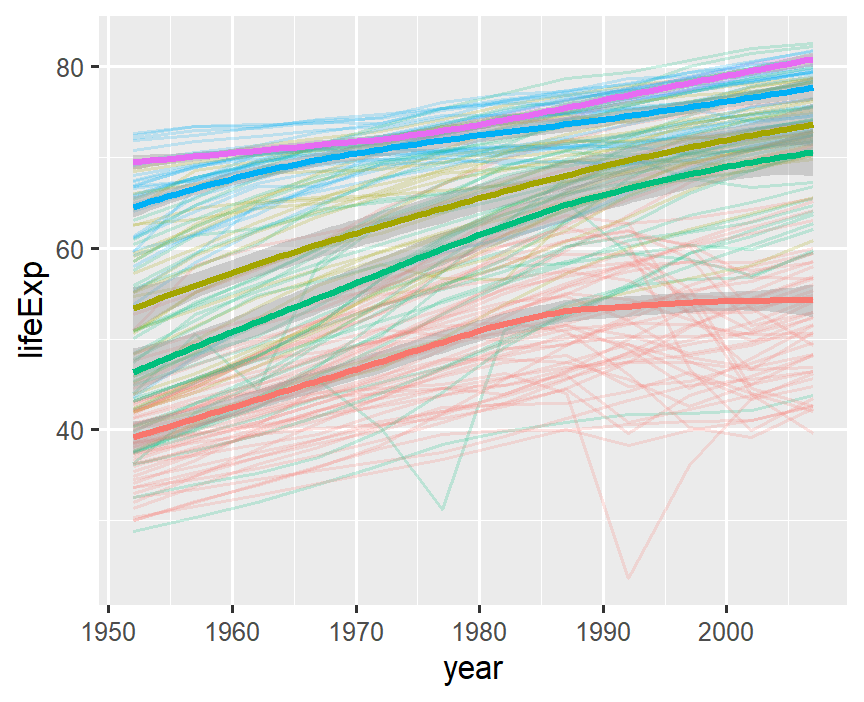 ] -- Wait, what color is each continent? --- .left-code[ ```r ggplot(gapminder, aes(x = year, y = lifeExp, color = continent)) + geom_line( aes(group = country), alpha = 0.2) + geom_smooth() + * theme( * legend.position = "bottom") ``` ] .right-plot[ 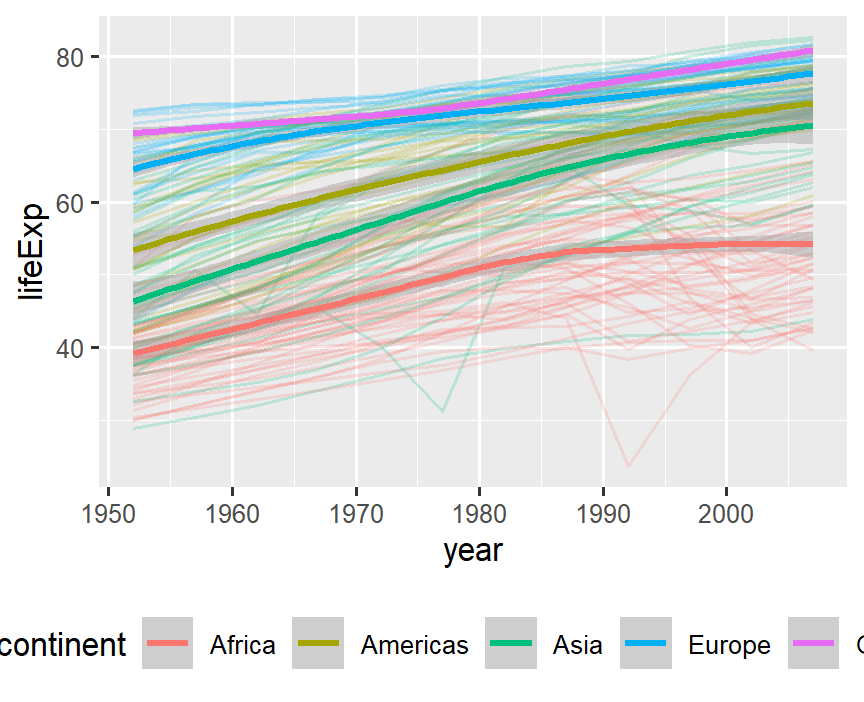 ] -- Let's try the minimal theme --- .left-code[ ```r ggplot(gapminder, aes(x = year, y = lifeExp, color = continent)) + geom_line( aes(group = country), alpha = 0.2) + geom_smooth() + * theme_minimal() + theme( legend.position = "bottom") ``` ] .right-plot[ 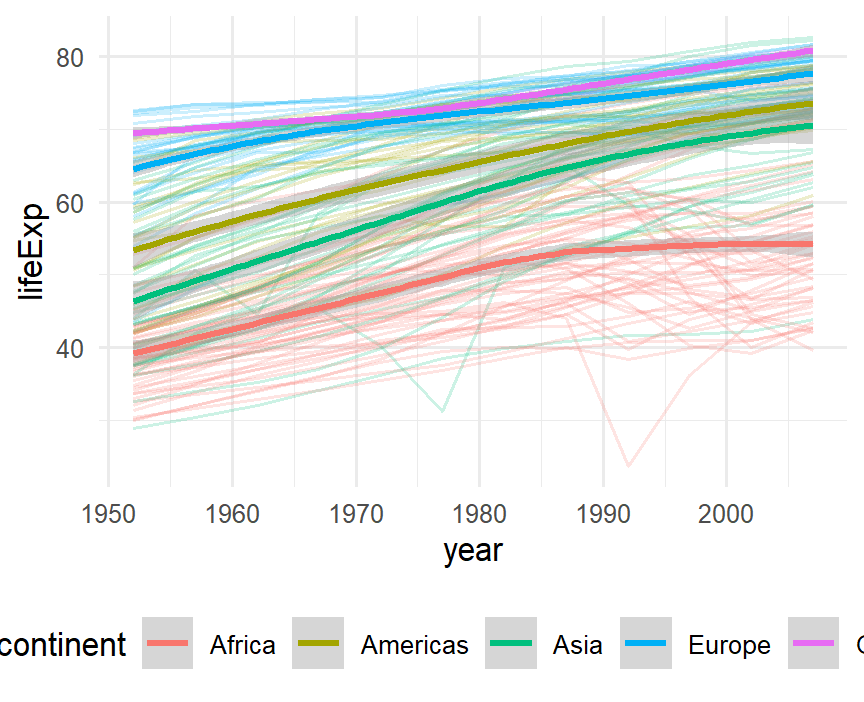 ] -- Fonts are kind of big --- .left-code[ ```r ggplot(gapminder, aes(x = year, y = lifeExp, color = continent)) + geom_line( aes(group = country), alpha = 0.2) + geom_smooth() + theme_minimal( * base_size = 10) + theme( legend.position = "bottom") ``` ] .right-plot[ 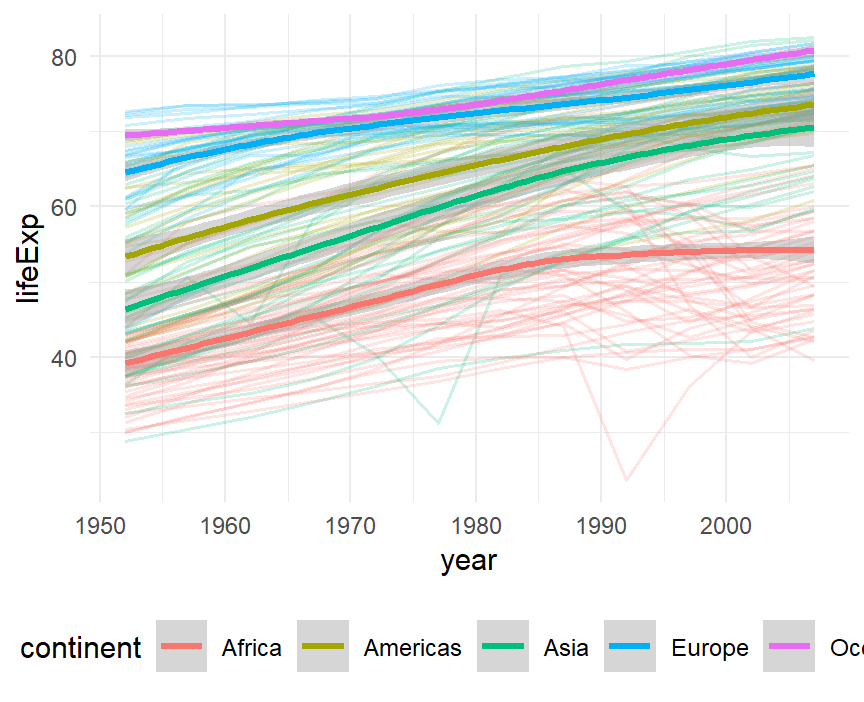 ] -- Great, let's switch gears --- .left-code[ ```r americas <- gapminder %>% filter( country %in% c( "Brazil", "Canada", "Mexico", "Ecuador" ) ) ``` Let's look at four countries in more detail. How do their populations compare to each other? ] .right-plot[ <!--  --> <div class="kable-table"> <table> <thead> <tr> <th style="text-align:left;"> country </th> <th style="text-align:left;"> continent </th> <th style="text-align:right;"> year </th> <th style="text-align:right;"> lifeExp </th> <th style="text-align:right;"> pop </th> <th style="text-align:right;"> gdpPercap </th> </tr> </thead> <tbody> <tr> <td style="text-align:left;"> Brazil </td> <td style="text-align:left;"> Americas </td> <td style="text-align:right;"> 1952 </td> <td style="text-align:right;"> 50.917 </td> <td style="text-align:right;"> 56602560 </td> <td style="text-align:right;"> 2108.944 </td> </tr> <tr> <td style="text-align:left;"> Brazil </td> <td style="text-align:left;"> Americas </td> <td style="text-align:right;"> 1957 </td> <td style="text-align:right;"> 53.285 </td> <td style="text-align:right;"> 65551171 </td> <td style="text-align:right;"> 2487.366 </td> </tr> <tr> <td style="text-align:left;"> Brazil </td> <td style="text-align:left;"> Americas </td> <td style="text-align:right;"> 1962 </td> <td style="text-align:right;"> 55.665 </td> <td style="text-align:right;"> 76039390 </td> <td style="text-align:right;"> 3336.586 </td> </tr> <tr> <td style="text-align:left;"> Brazil </td> <td style="text-align:left;"> Americas </td> <td style="text-align:right;"> 1967 </td> <td style="text-align:right;"> 57.632 </td> <td style="text-align:right;"> 88049823 </td> <td style="text-align:right;"> 3429.864 </td> </tr> <tr> <td style="text-align:left;"> Brazil </td> <td style="text-align:left;"> Americas </td> <td style="text-align:right;"> 1972 </td> <td style="text-align:right;"> 59.504 </td> <td style="text-align:right;"> 100840058 </td> <td style="text-align:right;"> 4985.711 </td> </tr> <tr> <td style="text-align:left;"> Brazil </td> <td style="text-align:left;"> Americas </td> <td style="text-align:right;"> 1977 </td> <td style="text-align:right;"> 61.489 </td> <td style="text-align:right;"> 114313951 </td> <td style="text-align:right;"> 6660.119 </td> </tr> <tr> <td style="text-align:left;"> Brazil </td> <td style="text-align:left;"> Americas </td> <td style="text-align:right;"> 1982 </td> <td style="text-align:right;"> 63.336 </td> <td style="text-align:right;"> 128962939 </td> <td style="text-align:right;"> 7030.836 </td> </tr> <tr> <td style="text-align:left;"> Brazil </td> <td style="text-align:left;"> Americas </td> <td style="text-align:right;"> 1987 </td> <td style="text-align:right;"> 65.205 </td> <td style="text-align:right;"> 142938076 </td> <td style="text-align:right;"> 7807.096 </td> </tr> <tr> <td style="text-align:left;"> Brazil </td> <td style="text-align:left;"> Americas </td> <td style="text-align:right;"> 1992 </td> <td style="text-align:right;"> 67.057 </td> <td style="text-align:right;"> 155975974 </td> <td style="text-align:right;"> 6950.283 </td> </tr> <tr> <td style="text-align:left;"> Brazil </td> <td style="text-align:left;"> Americas </td> <td style="text-align:right;"> 1997 </td> <td style="text-align:right;"> 69.388 </td> <td style="text-align:right;"> 168546719 </td> <td style="text-align:right;"> 7957.981 </td> </tr> </tbody> </table> </div> ] --- .left-code[ ```r ggplot(americas, aes(x = year, y = pop) ) + geom_col() ``` ] .right-plot[ 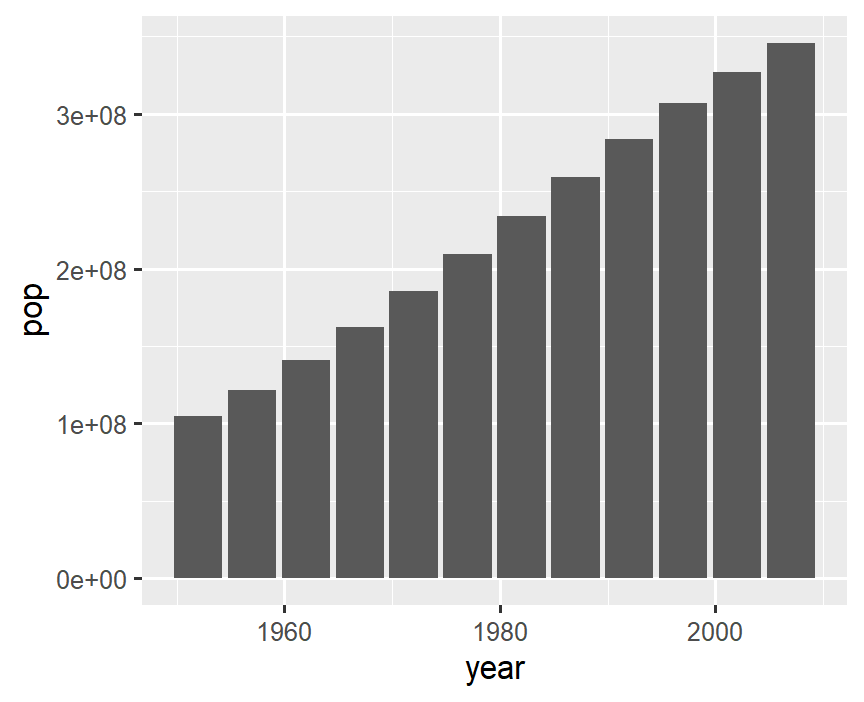 ] -- Yeah, but how many people are in each country? --- .left-code[ ```r ggplot(americas, aes(x = year, y = pop, * fill = country) ) + geom_col() ``` ] .right-plot[ 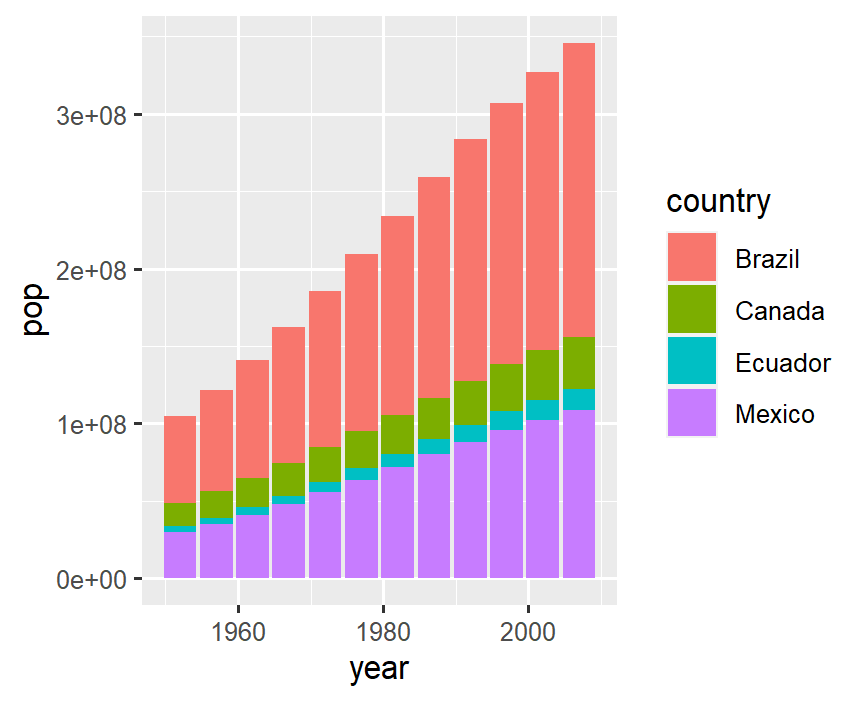 ] -- Can we reorder by population size? --- .left-code[ Excellent tutorial by Jenny Bryan ["Be the Boss of your factors"](https://stat545.com/factors-boss.html) ```r ggplot(americas, aes(x = year, y = pop, * fill = fct_reorder( * country, pop) ) ) + geom_col() ``` ] .right-plot[ 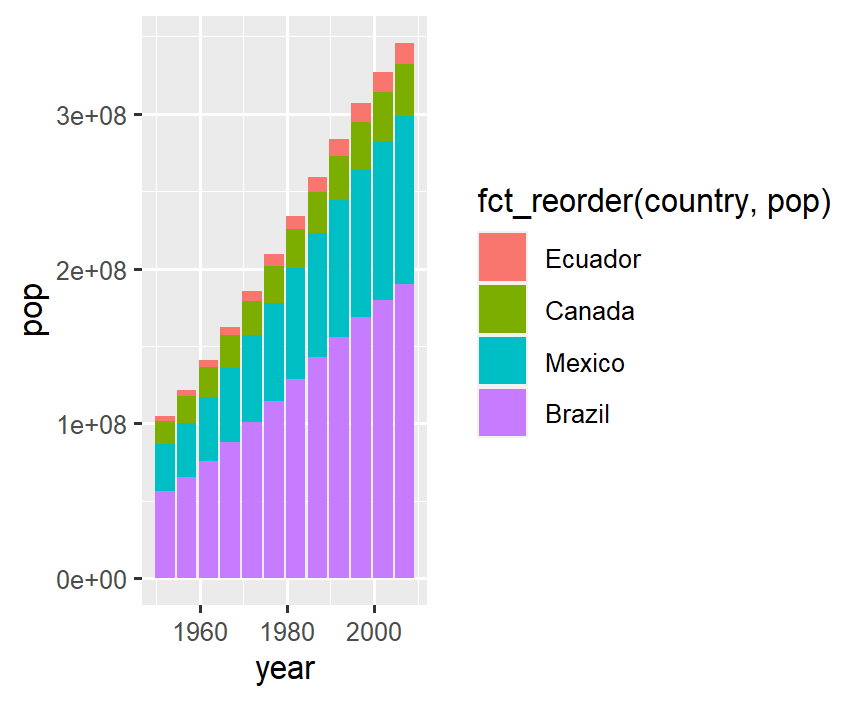 ] -- Can we change the labels? --- .left-code[ Excellent tutorial by Jenny Bryan ["Be the Boss of your factors"](https://stat545.com/factors-boss.html) ```r ggplot(americas, aes(x = year, y = pop, * fill = fct_reorder( * country, pop) ) ) + geom_col() + * labs(fill = "Country") ``` ] .right-plot[ 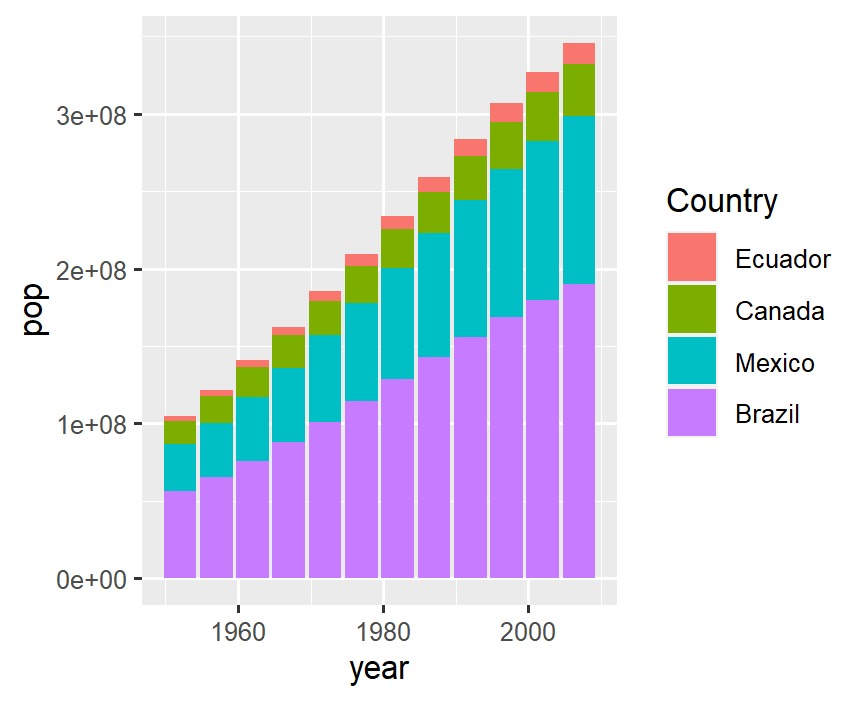 ] What's the difference between a bar chart and a pie chart? --- .left-code[ ```r ggplot(americas, * aes(x = " ", y = pop, fill = fct_reorder( country, pop) ) ) + geom_col() + labs(fill = "Country") + * coord_polar(theta = "y", start = 0) ``` ] .right-plot[ 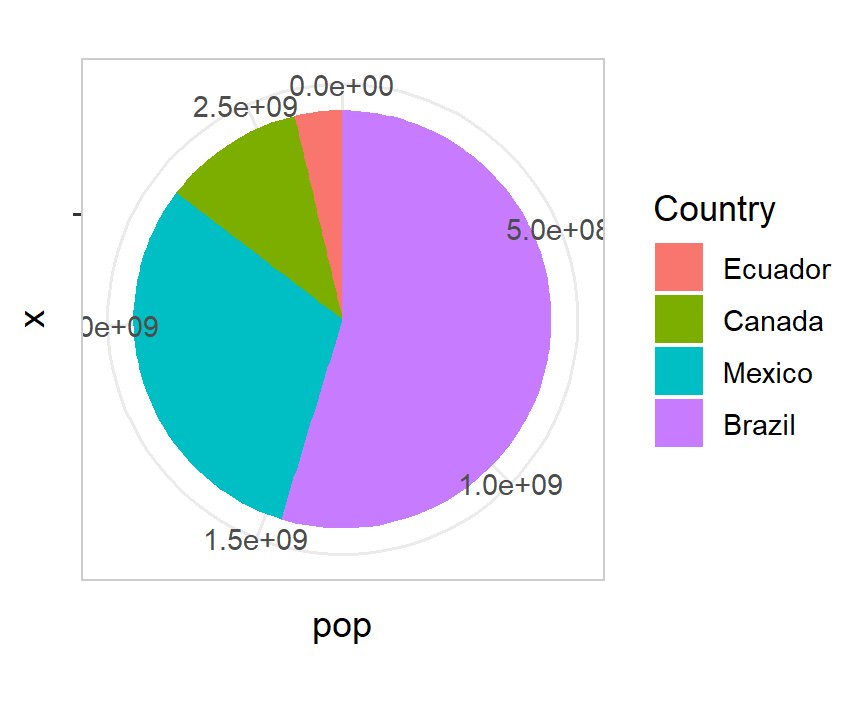 ] -- What if we want to see each year? --- .left-code[ ```r ggplot(americas, aes(x = " ", y = pop, fill = fct_reorder( country, pop) ) ) + geom_col() + labs(fill = "Country") + coord_polar(theta = "y", start = 0) + * facet_wrap(~year) ``` ] .right-plot[ 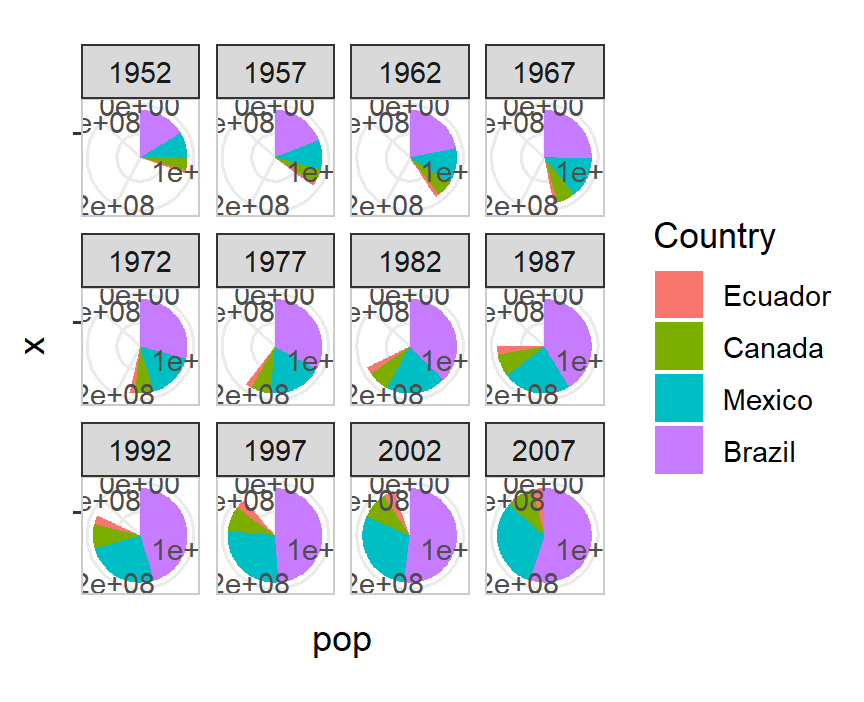 ] Short Aside: [Why you should consider alternatives to pie charts](https://www.data-to-viz.com/caveat/pie.html) --- .left-code[ Excellent tutorial by Jenny Bryan ["Be the Boss of your factors"](https://stat545.com/factors-boss.html) ```r ggplot(americas, aes(x = year, y = pop, * fill = fct_reorder( * country, pop) ) ) + geom_col() + * labs(fill = "Country") ``` ] .right-plot[ 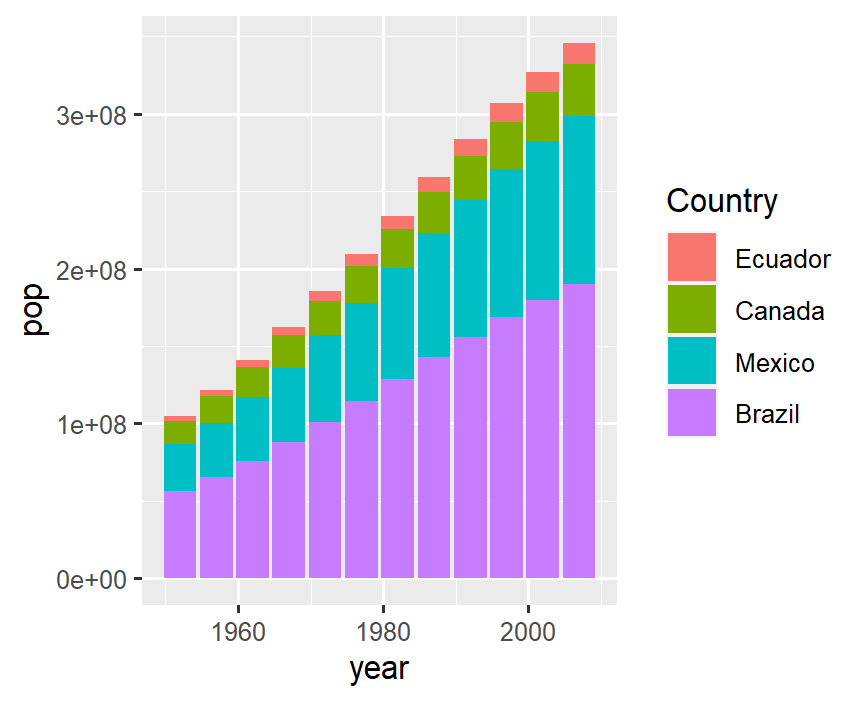 ] What if we want to see the bars side by side --- .left-code[ ```r ggplot(americas, aes(x = year, y = pop, fill = fct_reorder( country, pop) ) ) + geom_col( * position = "dodge") + labs(fill = "Country") ``` `position = "dodge"` places objects _next to each other_ instead of overlapping ] .right-plot[ 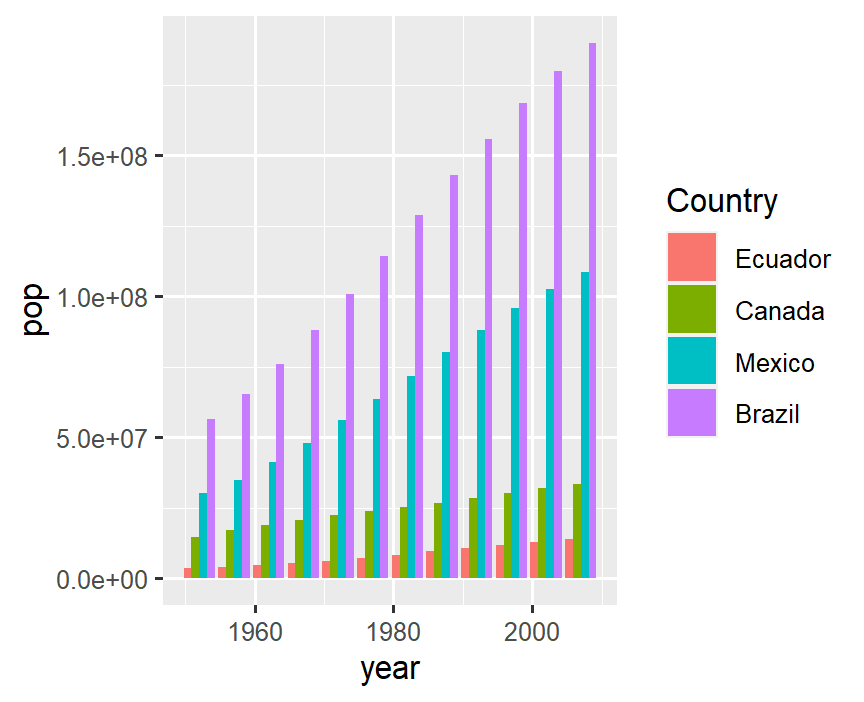 ] -- 🤓 What is scientific notation anyway? --- .left-code[ ```r ggplot(americas, aes(x = year, * y = pop / 10^6, fill = fct_reorder( country, pop) ) ) + geom_col( position = "dodge" ) + labs(fill = "Country", * y = "Population (millions)" ) ``` ggplot aesthetics can take expressions! ] .right-plot[ 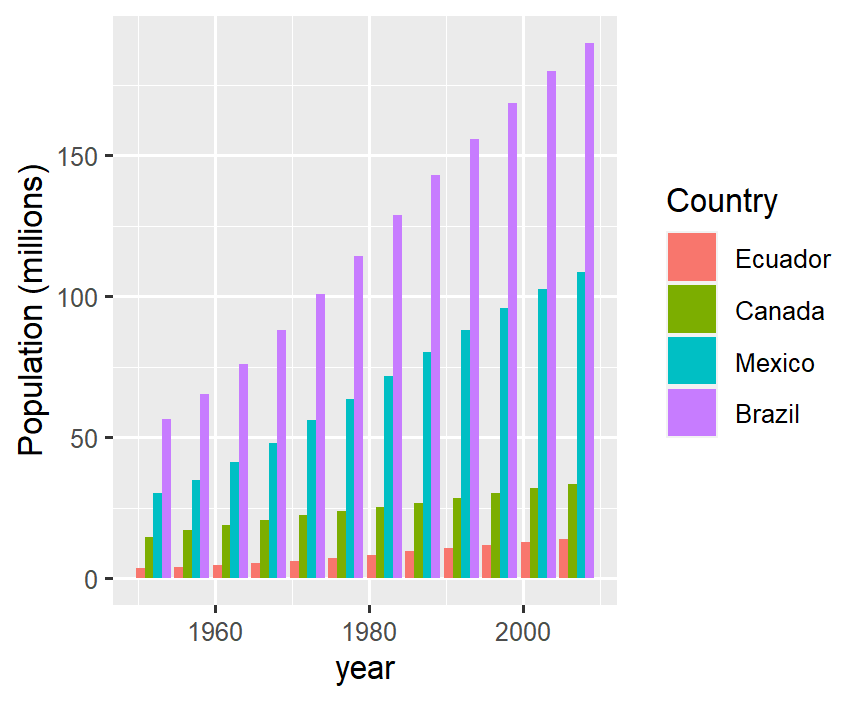 ] -- Might be easier to see countries individually --- .left-code[ ```r ggplot(americas, aes(x = year, * y = pop / 10^6, * fill = country) ) + geom_col( position = "dodge" ) + labs(y = "Population (millions)") + * facet_wrap(~ country) + * guides(fill = FALSE) ``` ] .right-plot[ 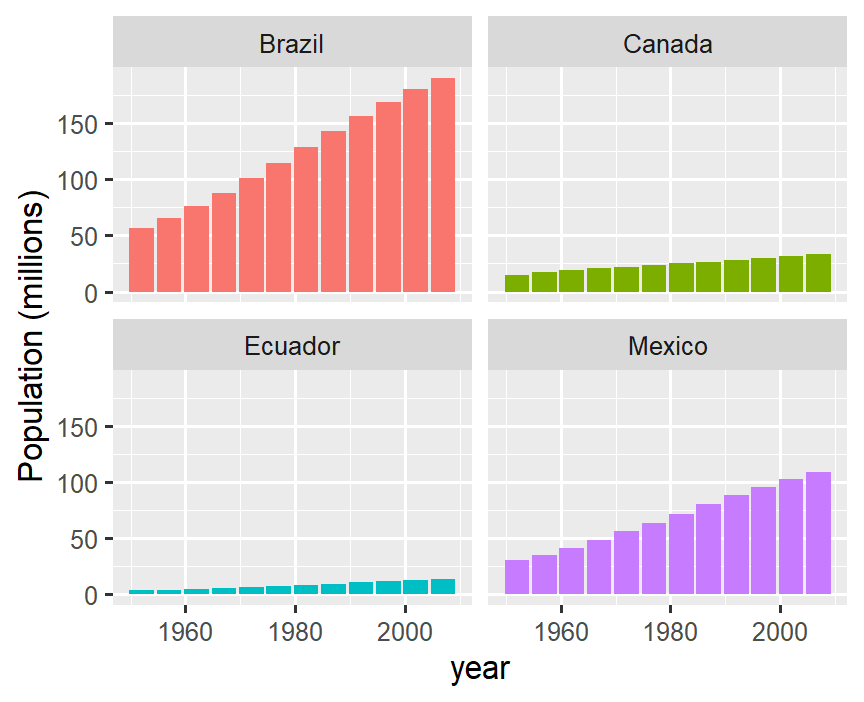 ] -- Let range of y-axis vary in each plot --- .left-code[ ```r ggplot(americas, aes(x = year, y = pop / 10^6, fill = country) ) + geom_col( position = "dodge" ) + labs(y = "Population (millions)") + facet_wrap(~ country, * scales = "free_y") + guides(fill = FALSE) ``` ] .right-plot[ 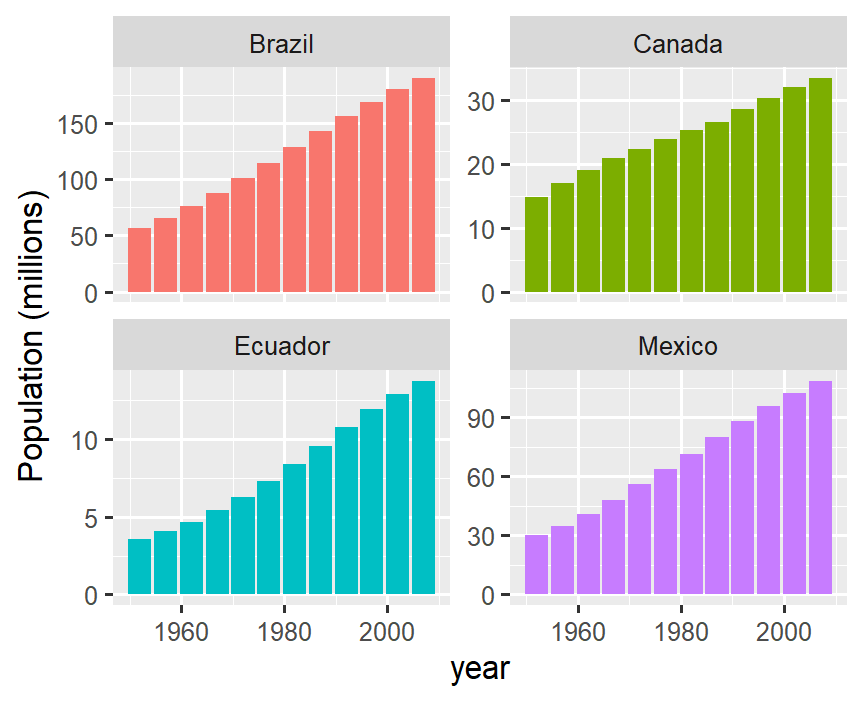 ] -- What about life expectancy again? --- .left-code[ ```r ggplot(americas, aes(x = year, * y = lifeExp, fill = country) ) + geom_col( position = "dodge" ) + facet_wrap(~ country, scales = "free_y") + guides(fill = FALSE) ``` ] .right-plot[ 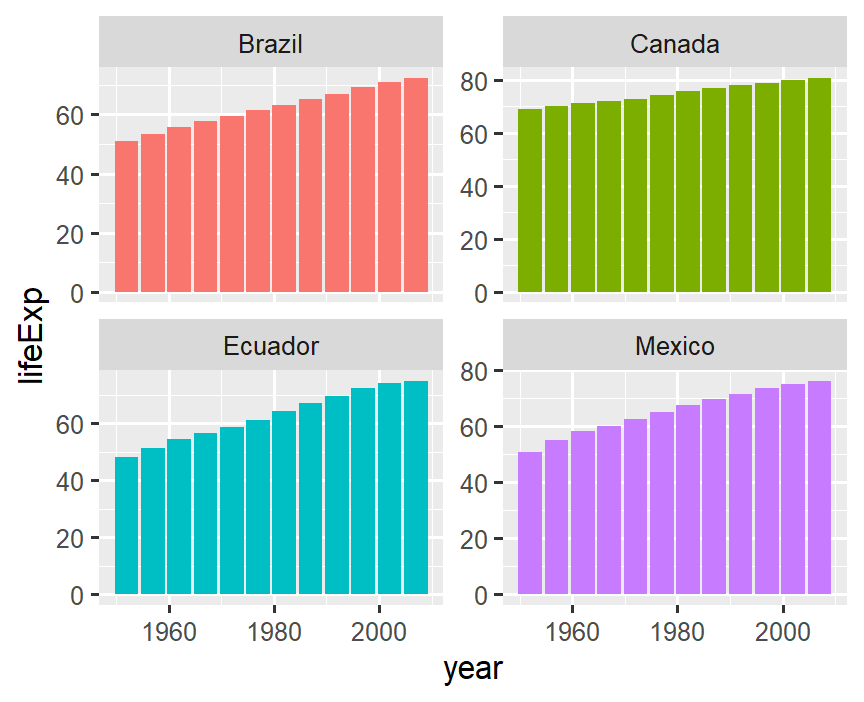 ] -- This should really be 📈 instead of 📊 --- .left-code[ ```r ggplot(americas, aes(x = year, y = lifeExp, fill = country) ) + * geom_line() + facet_wrap(~ country, scales = "free_y") + guides(fill = FALSE) ``` ] .right-plot[ 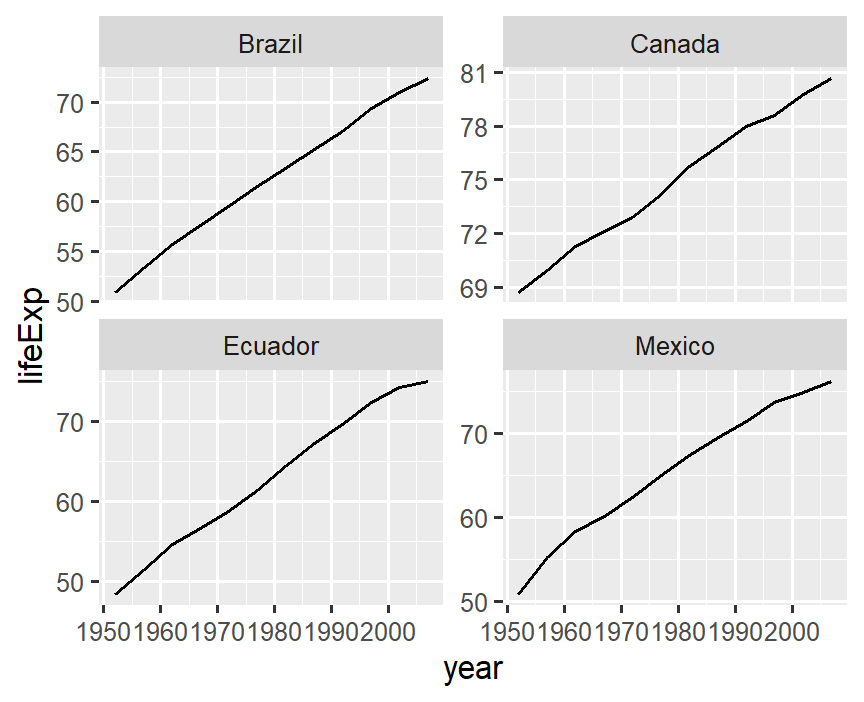 ] -- 📊 are **fill**ed, 📈 are **color**ed --- .left-code[ ```r ggplot(americas) + aes( x = year, y = lifeExp, * color = country ) + geom_line() + facet_wrap(~ country, scales = "free_y") + * guides(color = FALSE) ``` ] .right-plot[ 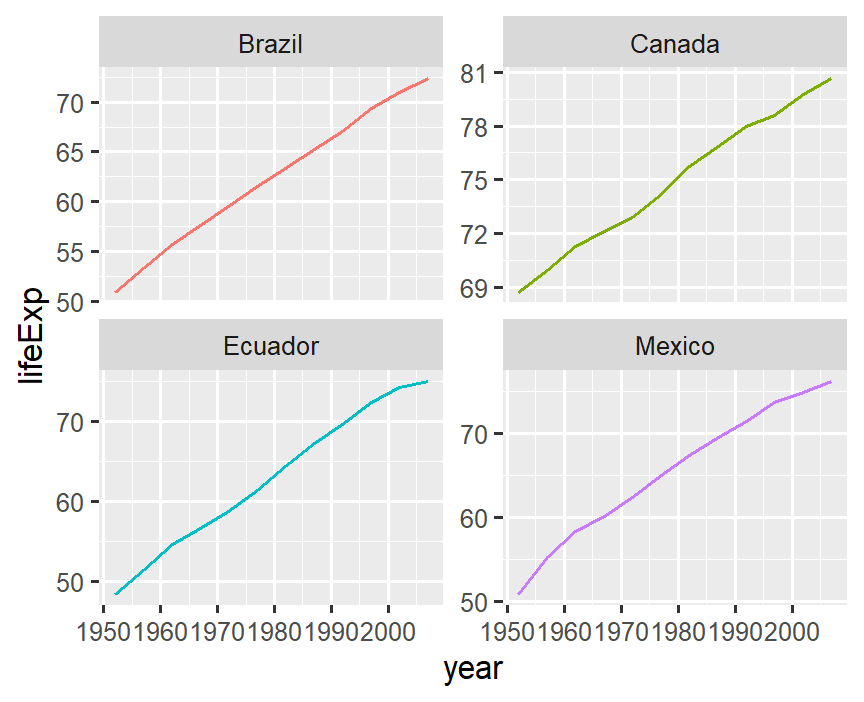 ] -- Altogether now! --- .left-code[ ```r ggplot(americas) + aes( x = year, y = lifeExp, color = country ) + geom_line() ``` ] .right-plot[ 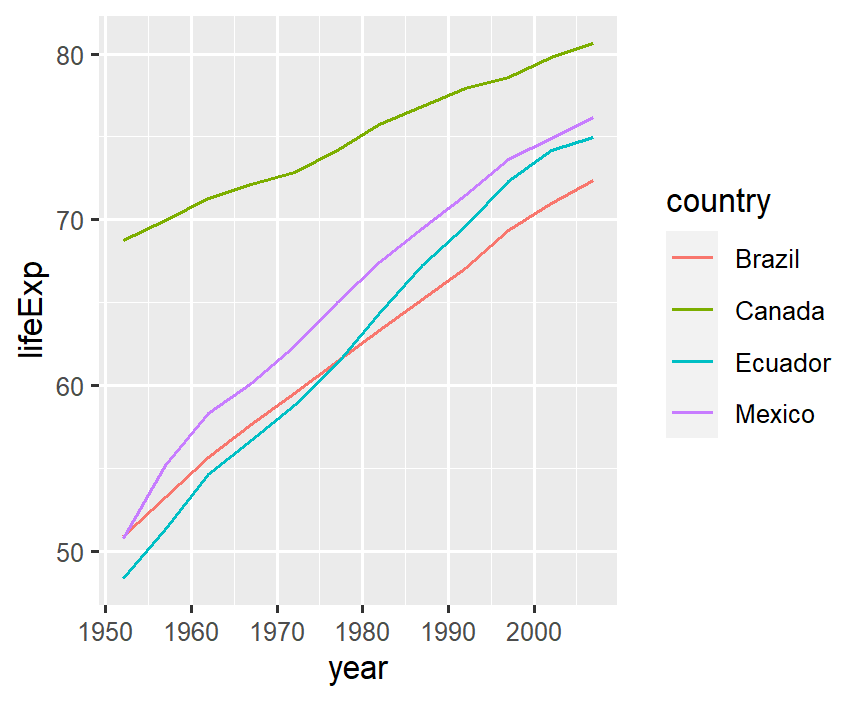 ] -- Let's update the labels --- .left-code[ ```r ggplot(americas, aes(x = year, y = lifeExp, color = country) ) + geom_line() + labs(x = "Year", y = "Life expectancy (years)", color = "Country", title = "Life expectancy over time") ``` ] .right-plot[ 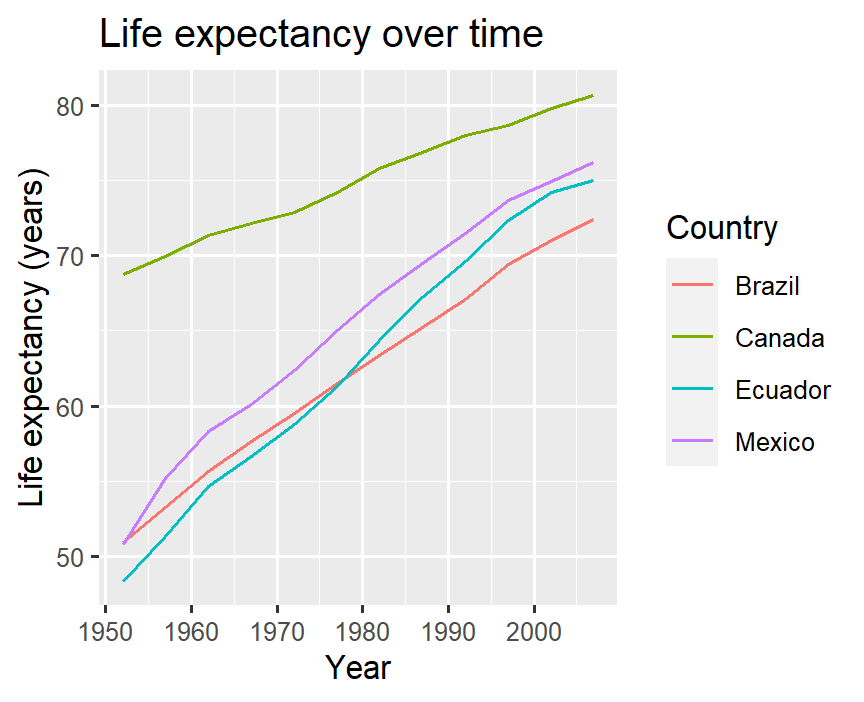 ] -- Okay, changing gears again. What is range of life expectancy in Americas? --- .left-code[ ```r gapminder %>% filter( continent == "Americas" * ) %>% * ggplot( aes(x = year, y = lifeExp) ) ``` You can pipe into `ggplot()`! Just watch for `%>%` changing to `+` ] .right-plot[  ] -- Boxplot for life expectancy range --- .left-code[ ```r gapminder %>% filter( continent == "Americas" ) %>% ggplot( aes(x = year, y = lifeExp) ) + * geom_boxplot() ``` ] .right-plot[ 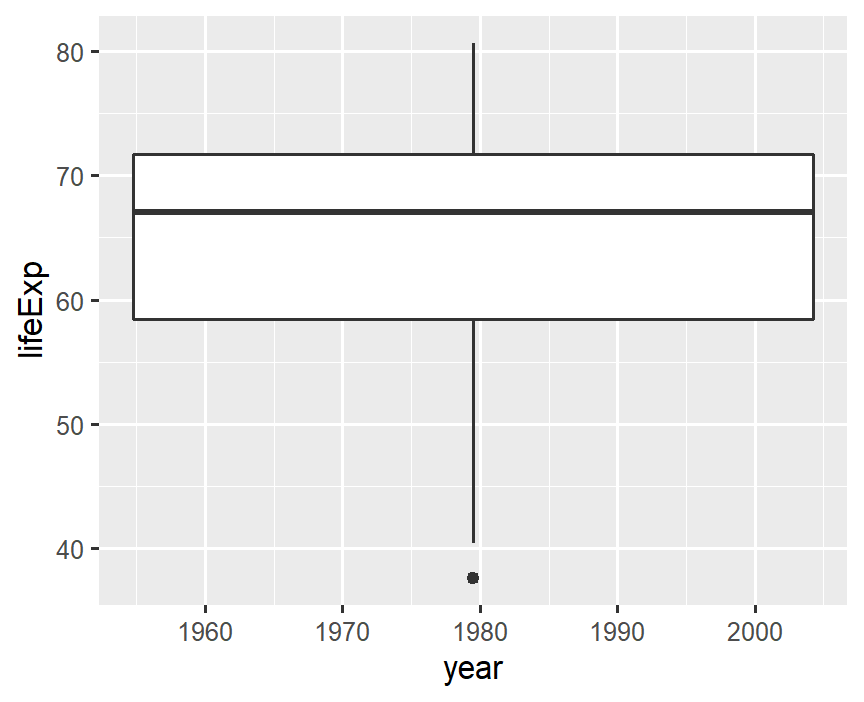 ] -- Why not boxplots by year? --- .left-code[ ```r gapminder %>% filter( continent == "Americas" ) %>% * mutate( * year = factor(year) * ) %>% ggplot( aes(x = year, y = lifeExp) ) + geom_boxplot() ``` ] .right-plot[ 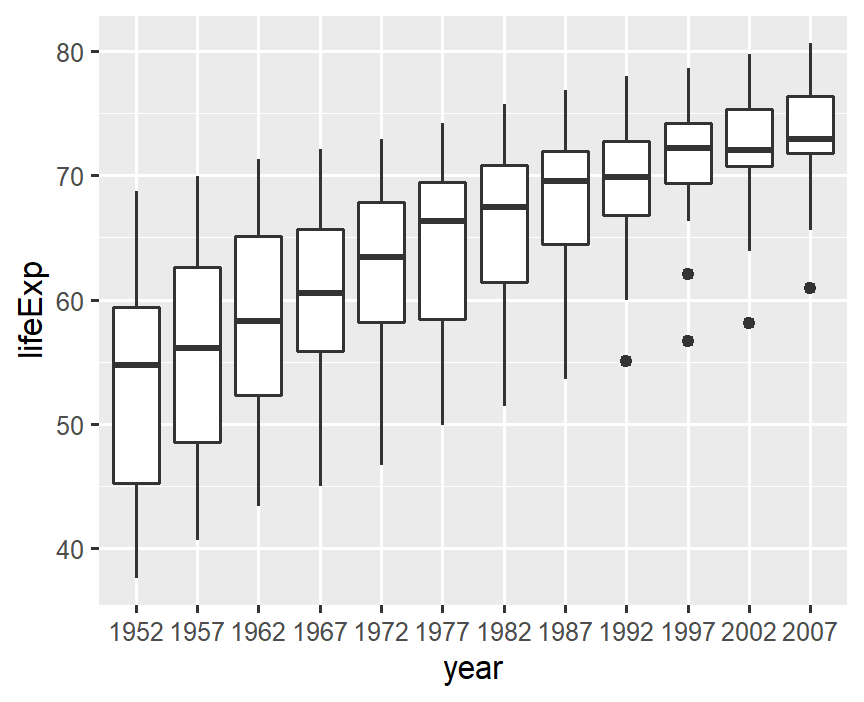 ] --- .left-code[ ```r gapminder %>% filter( continent == "Americas" ) %>% mutate( year = factor(year) ) %>% ggplot( aes(x = year, y = lifeExp) ) + geom_boxplot() + * coord_flip() ``` ] .right-plot[ 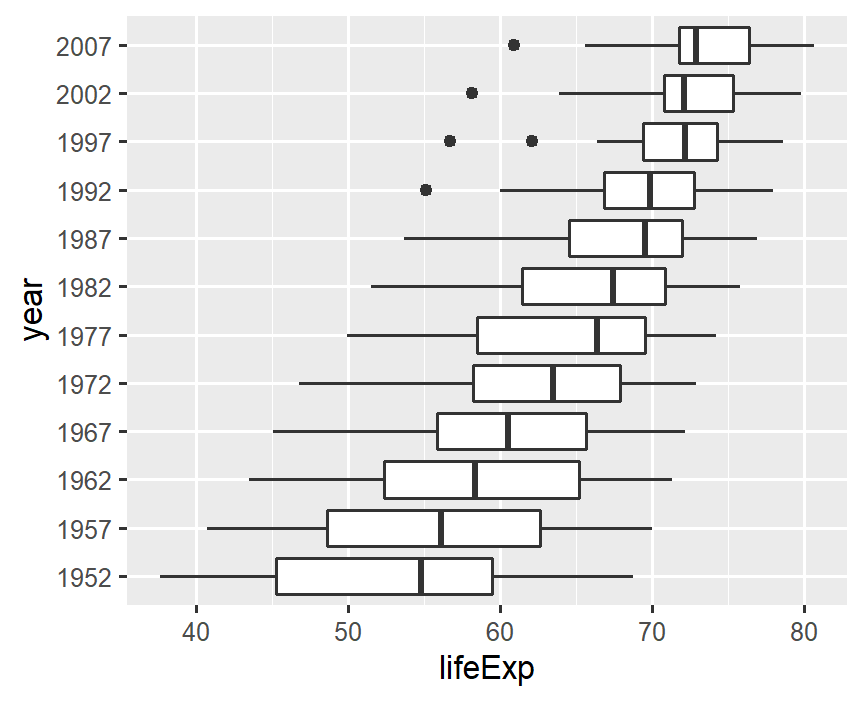 ] --- layout: false class: inverse, middle, center # Recap and where to go next --- layout: true # Plots are built in layers --- .font120[ - **Data** must be in a "tidy" format. ] -- .font120[ - **.hlb[Aes]thetic mappings** link variables in the data to graphical properties in the **.hlb[geom]**etric objects. ] -- .font120[ - **.hlb[Geom]etric objects** dictate how the **.hlb[aes]thetics** are interpreted as a graphical representation (points, lines, polygons, etc.) ] -- .font120[ - **.hlb[Stat]istics** transform the input variables to displayed values. E.g. calculate the summary statistics for a boxplot (quantiles). ] -- .font120[ - **.hlb[Coord]inates** organize location of geometric objects, i.e. define the physical mapping of the aesthetics. ] --- layout: true # Plots are built in layers --- .font120[ - **.hlb[Scale]s** define the range of values for aesthetics (e.g. categories -> colours). ] -- .font120[ - **.hlb[Facet]s** define the number of panels and how to split data among them (e.g. by country). ] -- .font120[ - **.hlb[Theme]s** control every part of the graphic that is not linked to the data (i.e. font, visual appearance). ] --- layout: true # Stack Exchange is Great! ---  --- <img src="images/stack-exchange-answer.png" style="max-height: 100%"> --- layout: false # ggplot2 Extensions: ggplot2-exts.org <img src="images/ggplot2-exts-gallery.png" style="max-height: 90%"> --- # ggplot2 and beyond ### Learn more - **Draw anything with ggplot2**: <https://github.com/thomasp85/ggplot2_workshop> - **Be the boss of your factors and other useful tips:** <https://stat545.com/index.html> - **ggplot2 docs:** <http://ggplot2.tidyverse.org/> - **R4DS - Data visualization:** <http://r4ds.had.co.nz/data-visualisation.html> - **Hadley Wickham's ggplot2 book:** <https://www.amazon.com/dp/0387981403/> --- # ggplot2 and beyond ### Noteworthy RStudio Add-Ins - [esquisse](https://github.com/dreamRs/esquisse): Interactively build ggplot2 plots - [ggplotThemeAssist](https://github.com/calligross/ggthemeassist): Customize your ggplot theme interactively - [ggedit](https://github.com/metrumresearchgroup/ggedit): Layer, scale, and theme editing --- # Practice and Review ### #TidyTuesday - <https://github.com/rfordatascience/tidytuesday> ### Fun Datasets - `fivethirtyeight` - `nycflights` - `ggplot2movies` --- class: inverse, center, middle # Thanks! Slides created via the R package [xaringan](https://github.com/yihui/xaringan). The chakra comes from [remark.js](https://remarkjs.com), [knitr](http://yihui.org/knitr), and [R Markdown](https://rmarkdown.rstudio.com). .font150.text-white[ Slides and code adapted from Garrick Aden-Buie GitHub: <http://github.com/gadenbuie/gentle-ggplot2> ]